


15th Apr 2025 · SEBI-Registered Analyst
STAROFMARKET ADVICE with MAYANK (SEBI RA) · 15th Apr 2025
Hindalco
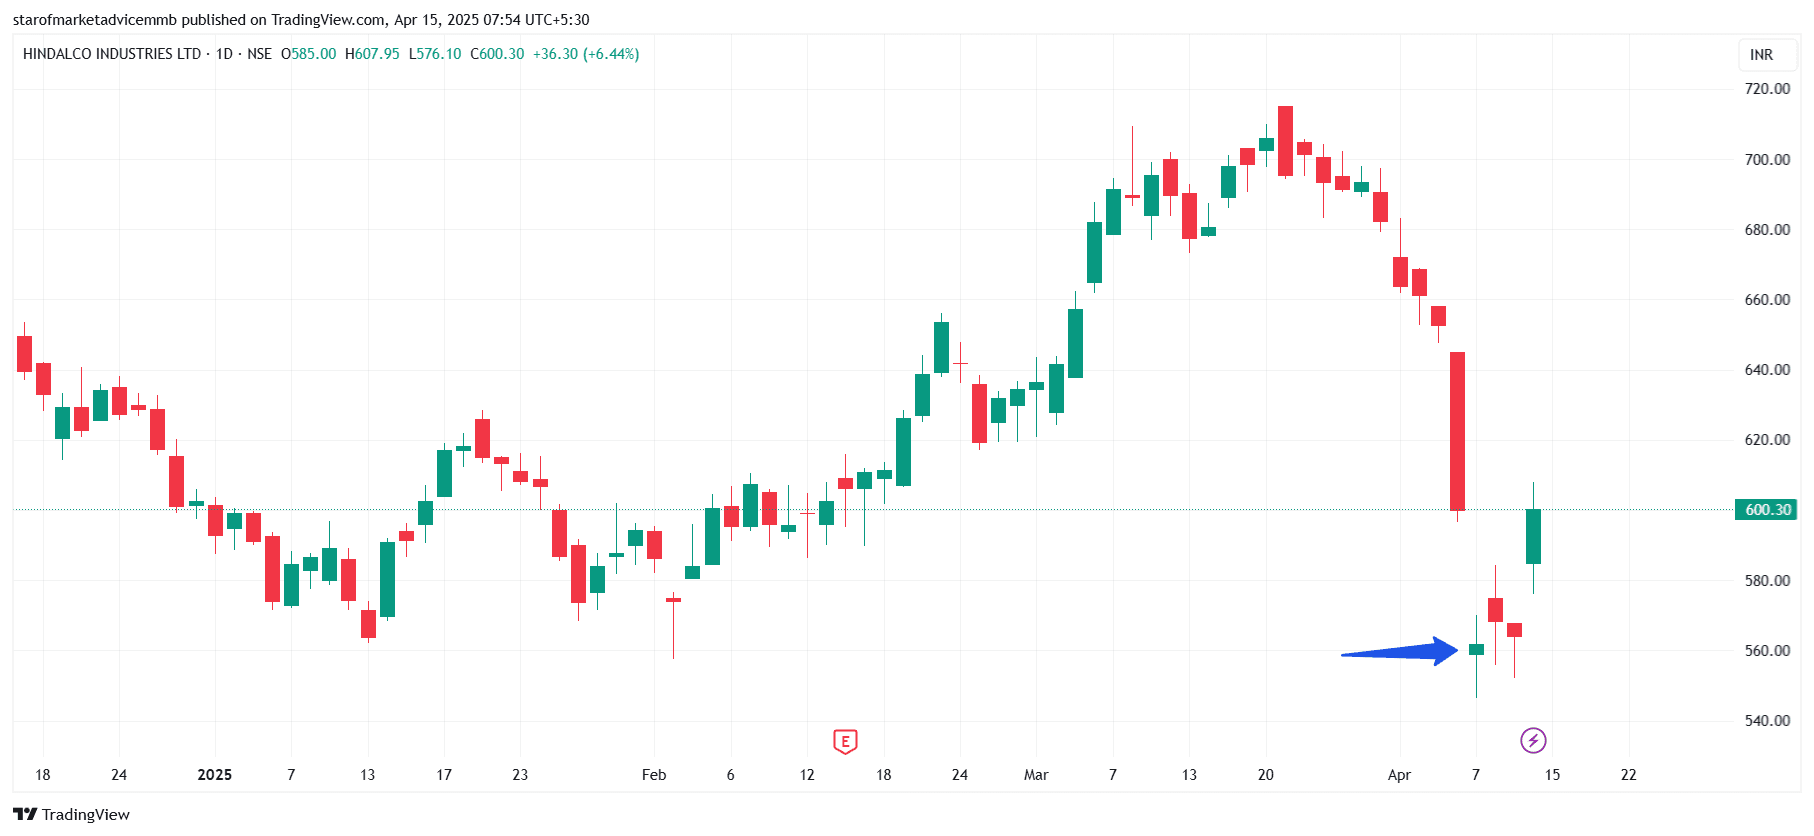
HINDALCO A Bullish Doji Candlestick Pattern is a key signal in technical analysis that suggests a potential reversal to the upside, especially when it forms at a support zone or after a downtrend.
🔹 What is a Doji?
A Doji forms when the open and close prices are almost the same, meaning there's indecision in the market. The buyers and sellers are in balance, but context is everything.
Example of Bullish doji candlestick chart pattern is attached
#WatchOutFor#Today’sTradingSetup#StockInNews#FundamentalViews#TechnicalViews
284 likes·82 comments