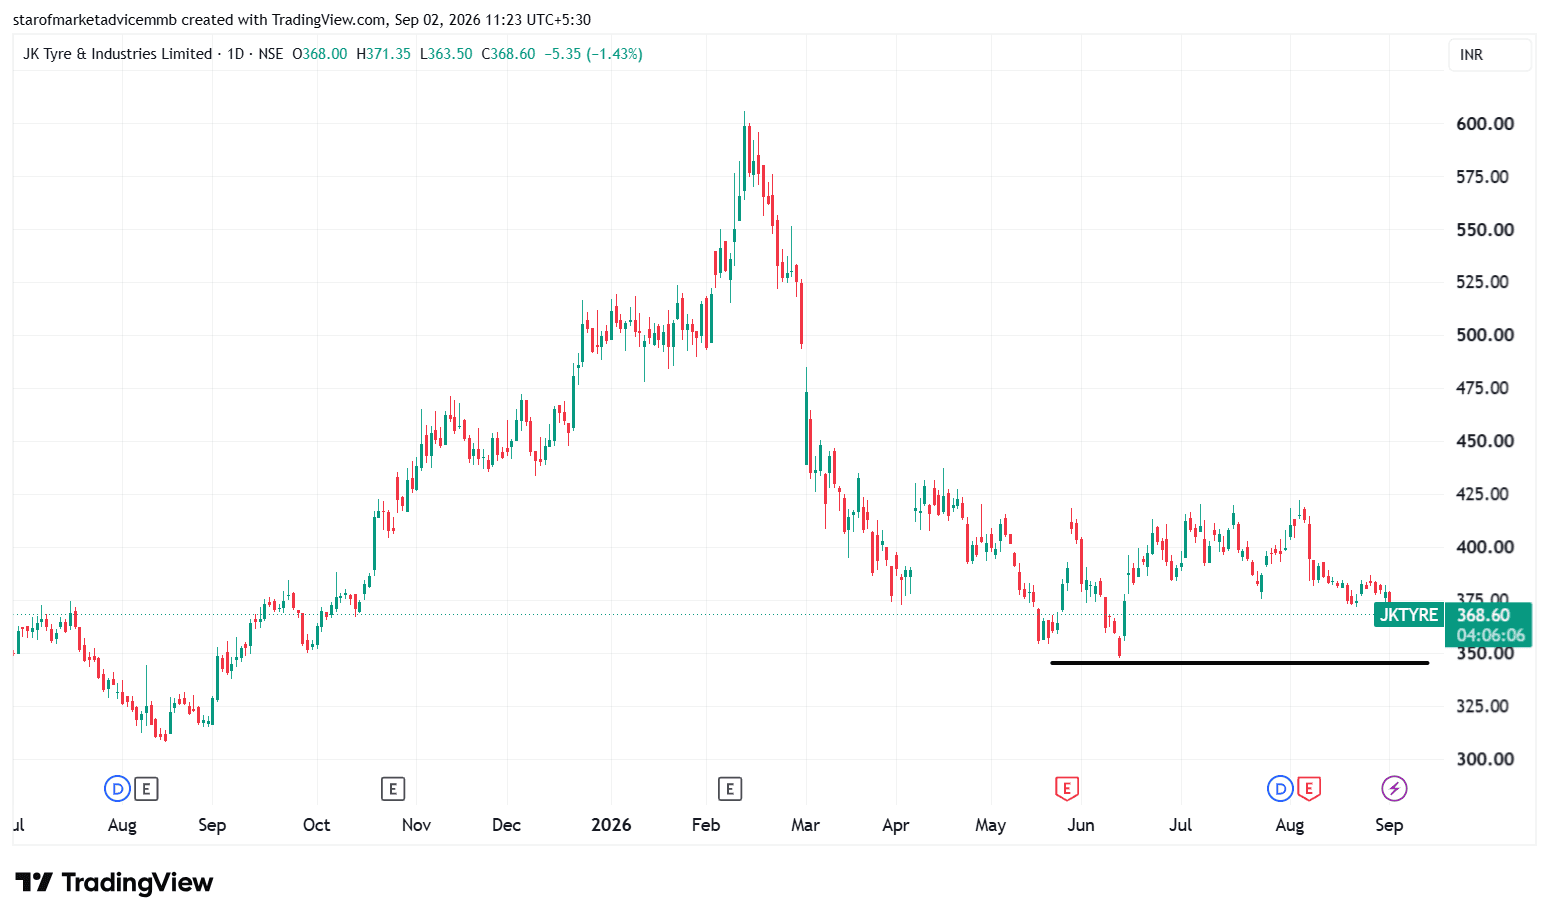
Base formation is a phase where a stock stops making strong lower lows and starts consolidating after a decline.
It indicates that selling pressure is gradually getting absorbed by buyers.
In the JK Tyre chart, the ₹345–₹350 zone is acting as an important base/support area.
Price has tested this zone multiple times but has not sustained below it, showing demand at lower levels.
After forming the base, the stock generally moves sideways, creating a range-bound structure.
During this phase, volatility often contracts and the stock builds energy for the next major move.
A breakout above the upper range/resistance with strong volume confirms a stronger bullish setup.
In this chart, the ₹415–₹425 zone can be considered an important resistance area from the recent range.
If ₹345–₹350 breaks decisively, the base formation would weaken and downside risk can increase.
Key concept: Decline → Selling exhaustion → Base formation → Accumulation → Breakout → New uptrend.