STAROFMARKET ADVICE with MAYANK (SEBI RA) · 16th Aug 2025
Naukri
NAUKRI
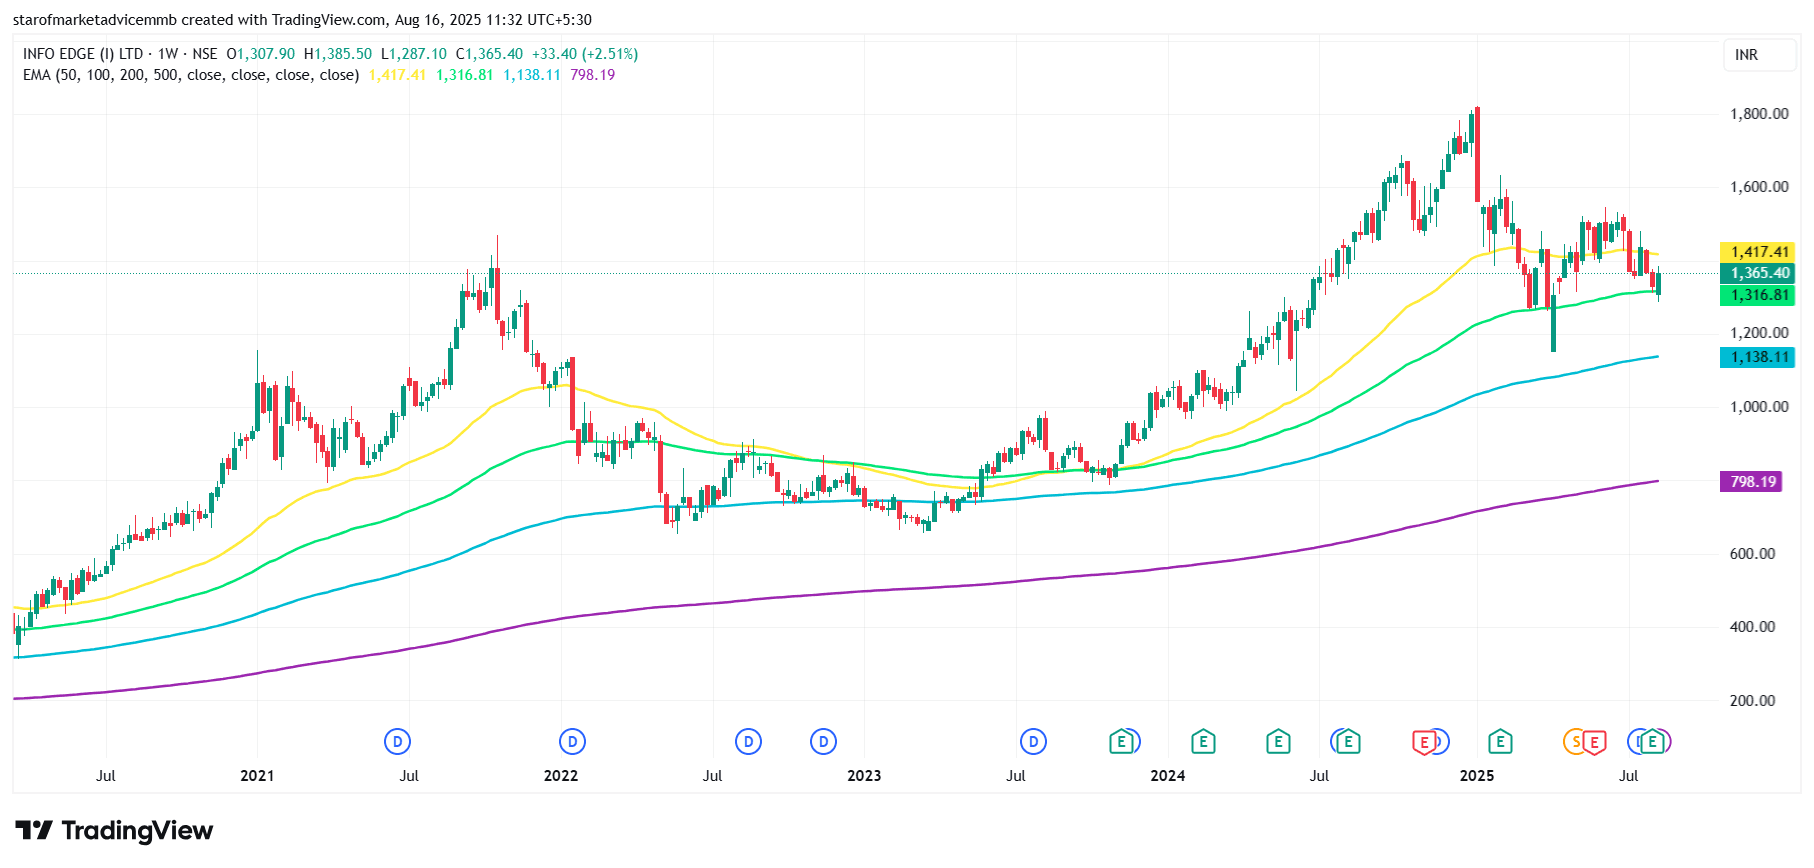
The weekly chart of Info Edge (Naukri) shows a recent bounce from the 200 EMA (green line at ~1316), indicating strong technical support at that level. The price is currently trading below the 50 EMA (~1417), signaling short-term weakness. However, the long-term trend remains intact as the price is above the 100 and 200 EMAs. After a sharp rally from early 2023 to early 2025, the stock has entered a correction phase, forming lower highs. The recent bullish candle suggests a possible short-term reversal or relief rally, but the stock needs to break and sustain above the 50 EMA for a confirmed trend continuation. Immediate support lies at 1316 and resistance around 1417.