


4th Apr 2025 · SEBI-Registered Analyst
STAROFMARKET ADVICE with MAYANK (SEBI RA) · 4th Apr 2025
persistent
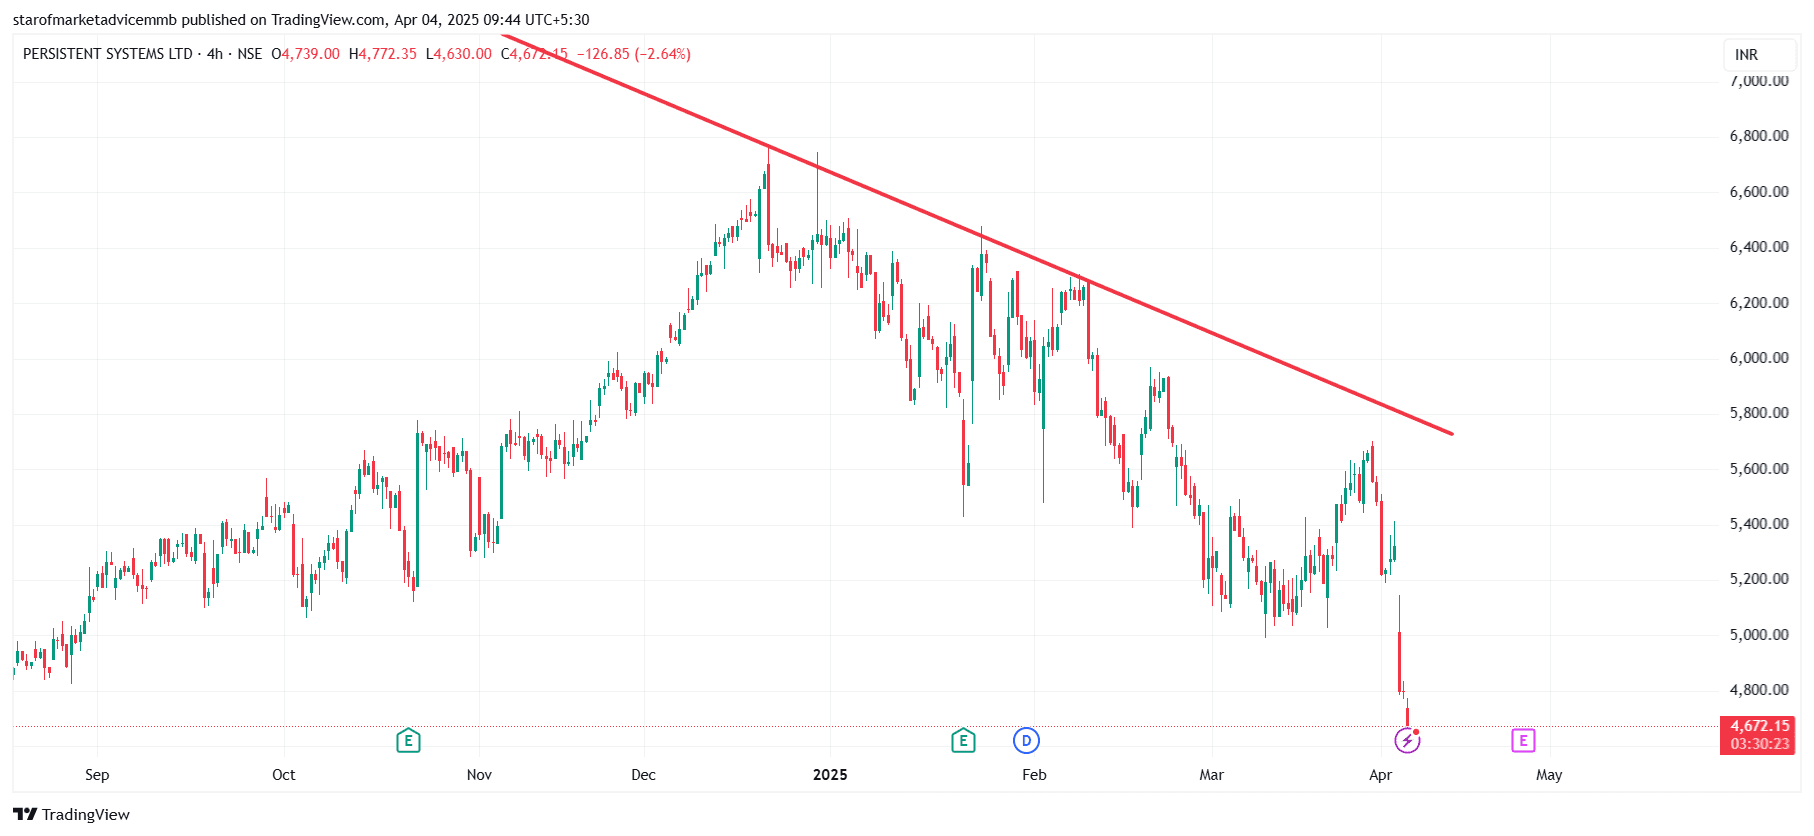
PERSISTENT A trendline resistance is a line drawn across two or more swing highs in a downtrend or consolidation zone. It acts as a ceiling where price struggles to break through and often reverses or consolidates when touched.
Stock chart is an example of how trendline resistance line works in the chart.
#Today’sTradingSetup#StockInNews#Budget2025#WatchOutFor#FundamentalViews
5 likes