STAROFMARKET ADVICE with MAYANK (SEBI RA) · 15th Jun 2025
Tanla
TANLA
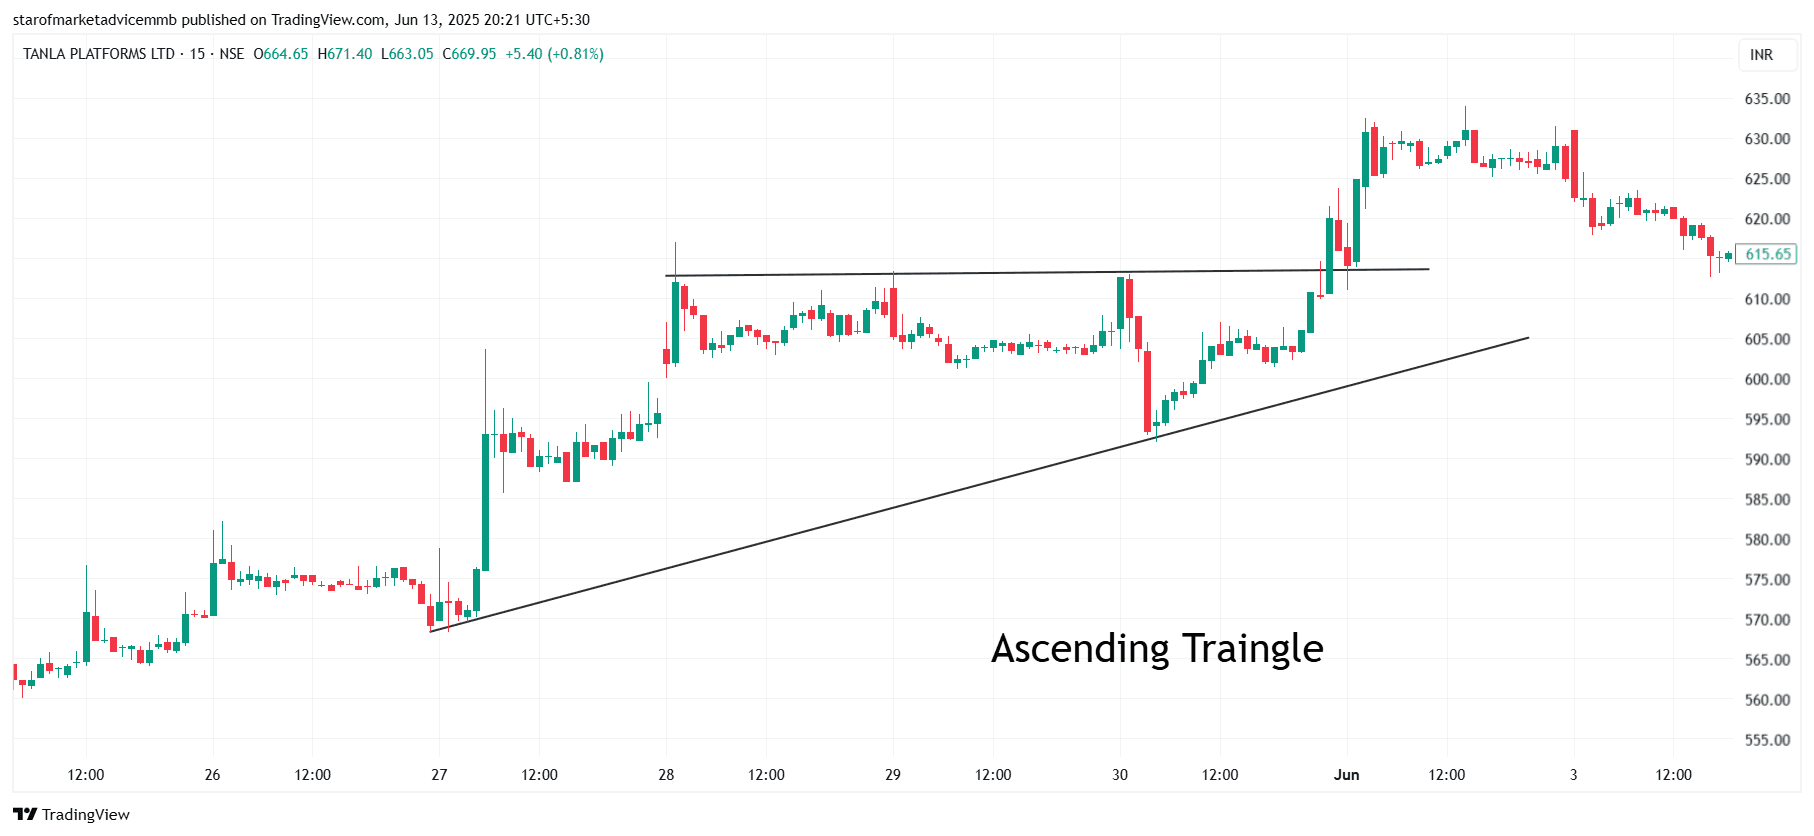
An Ascending Triangle is a bullish continuation chart pattern that typically forms during an uptrend. It signals that buyers are becoming increasingly aggressive, while sellers are holding a specific resistance level.
tructure of Ascending Triangle:
Horizontal Resistance Line (Upper Line)
Price keeps hitting a fixed resistance level, but fails to break it initially.
This shows that sellers are active at that level.
Rising Support Line (Lower Line)
Each time the price drops, it makes a higher low, forming a rising trendline.
This means buyers are stepping in earlier each time.
Converging Lines
The two lines (horizontal resistance and rising support) move toward each other, creating a triangle shape.