3rd Apr 2025 · SEBI-Registered Analyst
STAROFMARKET ADVICE with MAYANK (SEBI RA) · 3rd Apr 2025
TCS
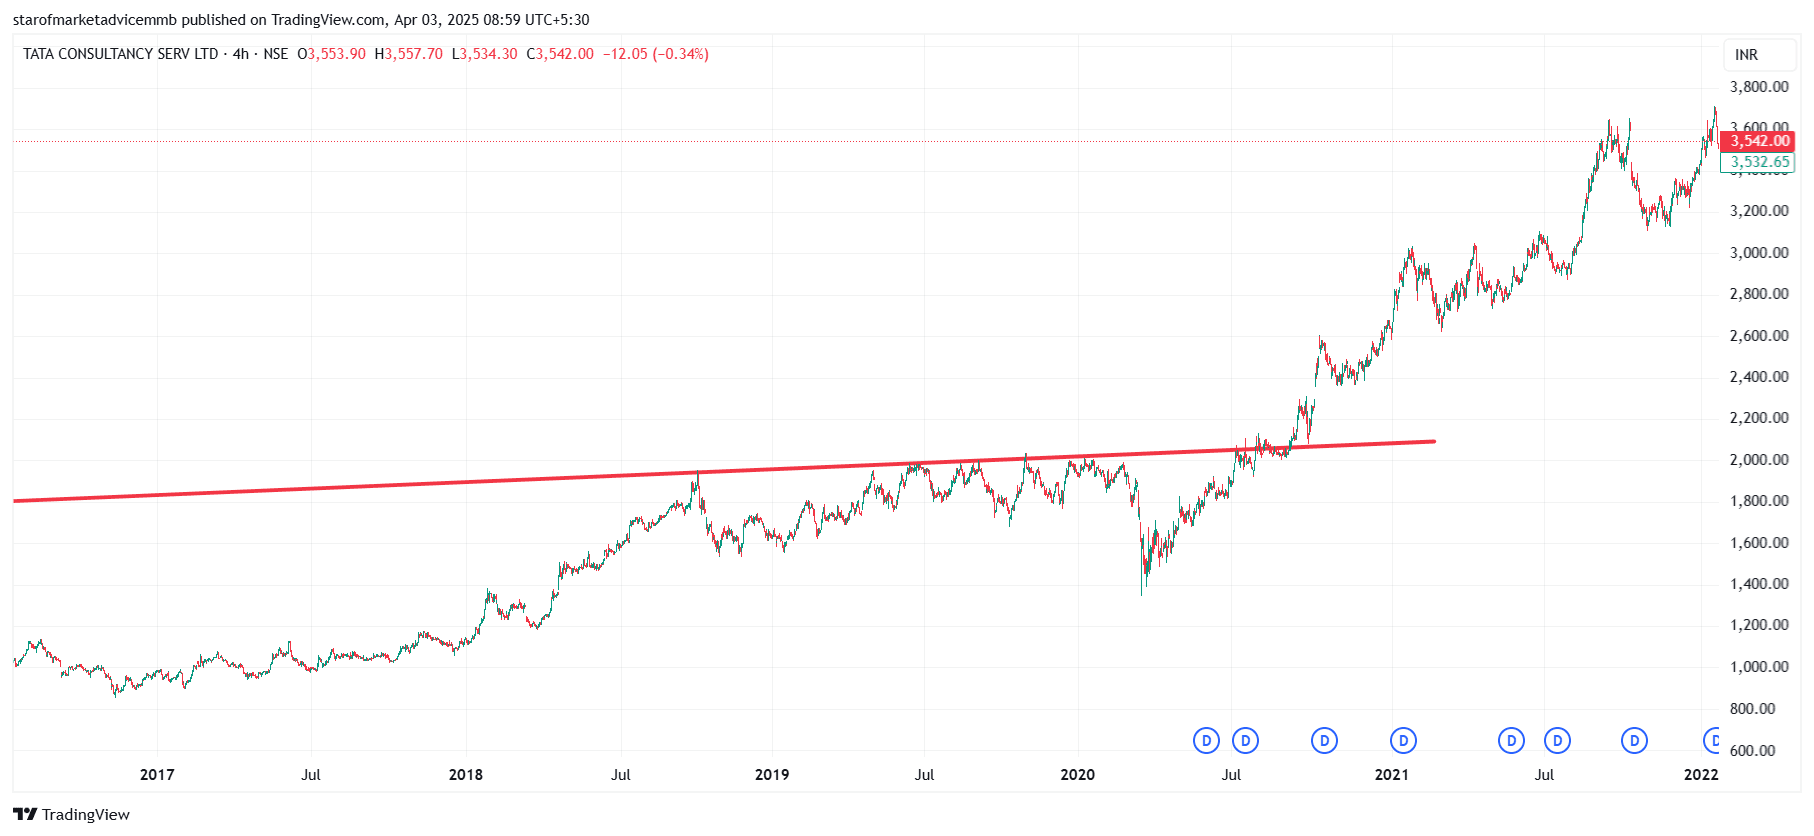
TCS A trendline breakout occurs when the price breaks above or below a well-established trendline, signaling a potential shift in market direction. It can be bullish (upside breakout) or bearish (downside breakout).
TCS stock chart is an example of trendline breakout.
#WatchOutFor#Today’sTradingSetup#StockInNews#TechnicalViews#FundamentalViews