


14th Aug 2025 · SEBI-Registered Analyst
STAROFMARKET ADVICE with MAYANK (SEBI RA) · 14th Aug 2025
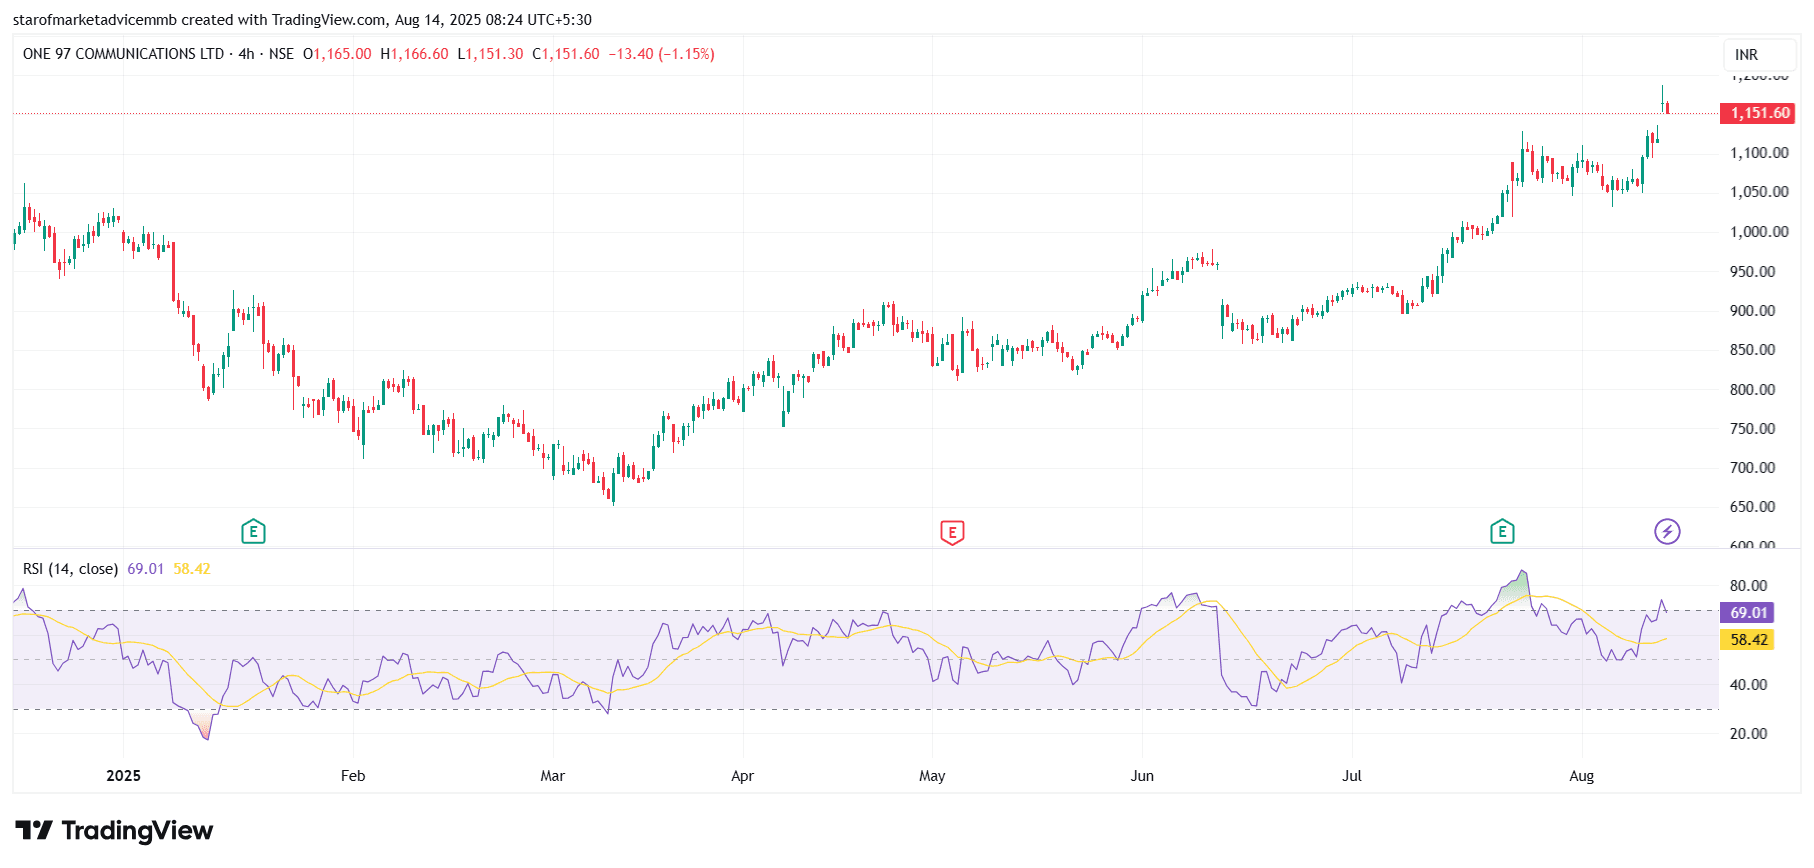
The 4-hour chart of One 97 Communications Ltd (Paytm) shows a strong uptrend from June onwards, recovering significantly from its earlier downtrend. The price recently hit a new short-term high but is currently experiencing a minor pullback, down 1.15% to ₹1,151.60. The RSI is at 69.01, close to the overbought zone, suggesting bullish momentum but also cautioning that the stock may face short-term resistance. A break above the recent high with RSI sustaining above 70 could signal further upside, whereas any rejection here might trigger a consolidation or minor correction. Overall, the trend remains bullish with healthy momentum.
PAYTM
#FundamentalViews#TechnicalViews
1,143 likes·27 comments