


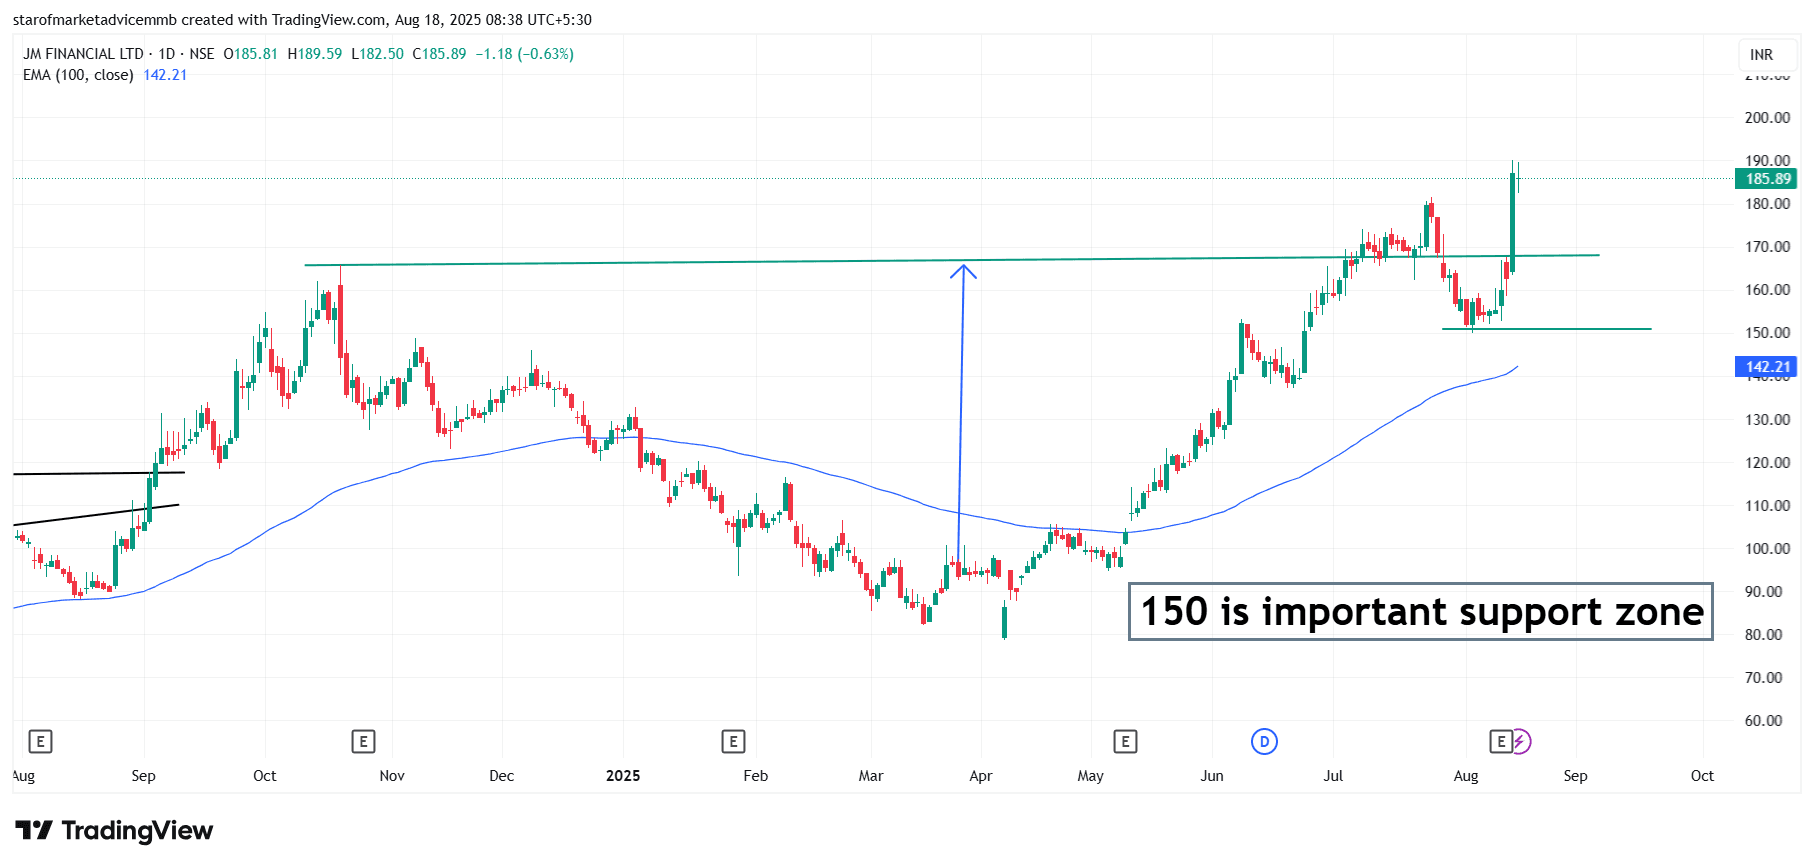
The chart of JM Financial Ltd shows a strong bullish breakout above the previous resistance zone near ₹175, following a successful retest of the ₹150 support level, which now acts as a strong demand zone. The price rebounded sharply after taking support near ₹150 and has rallied with strong momentum, backed by high-volume green candles, indicating renewed buying interest. The stock is also trading well above the 100-day EMA (₹142.21), reinforcing the bullish sentiment. As long as the price sustains above ₹175, the next upside targets could be ₹200 and above, while ₹150 remains a key support for any pullback. $JMFINANCIL
#FundamentalViews#TechnicalViews
522 likes·26 comments