


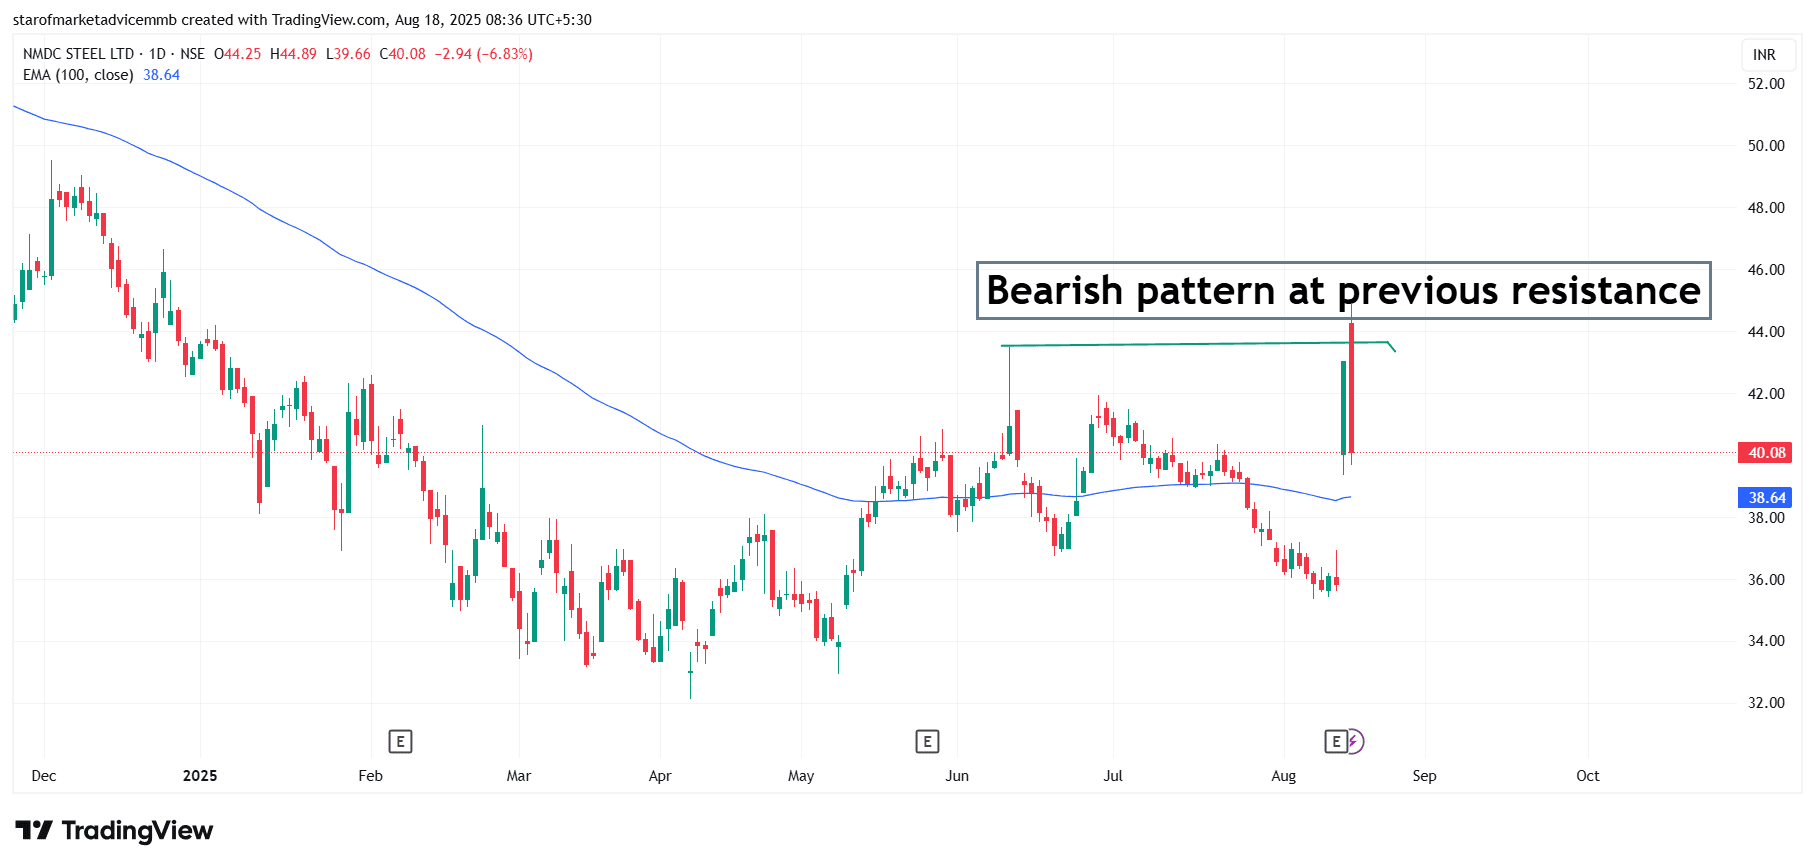
The chart of NMDC Steel Ltd shows a clear bearish engulfing pattern forming at a previous resistance level near ₹44, which strongly indicates a potential reversal. After testing the resistance zone, the stock formed a large red candle that completely engulfed the previous green candle, suggesting aggressive selling pressure. This bearish reversal is further supported by the price being near the 100-day EMA, adding to the resistance strength. The sharp rejection from the resistance zone and the heavy bearish candle imply that sellers have regained control, and a further downside move toward the ₹38–₹36 levels cannot be ruled out if the weakness persists. $NSLNISP
#FundamentalViews#TechnicalViews
737 likes·75 comments