


6th Jul 2025 · SEBI-Registered Analyst
STAROFMARKET ADVICE with MAYANK (SEBI RA) · 6th Jul 2025
Trent
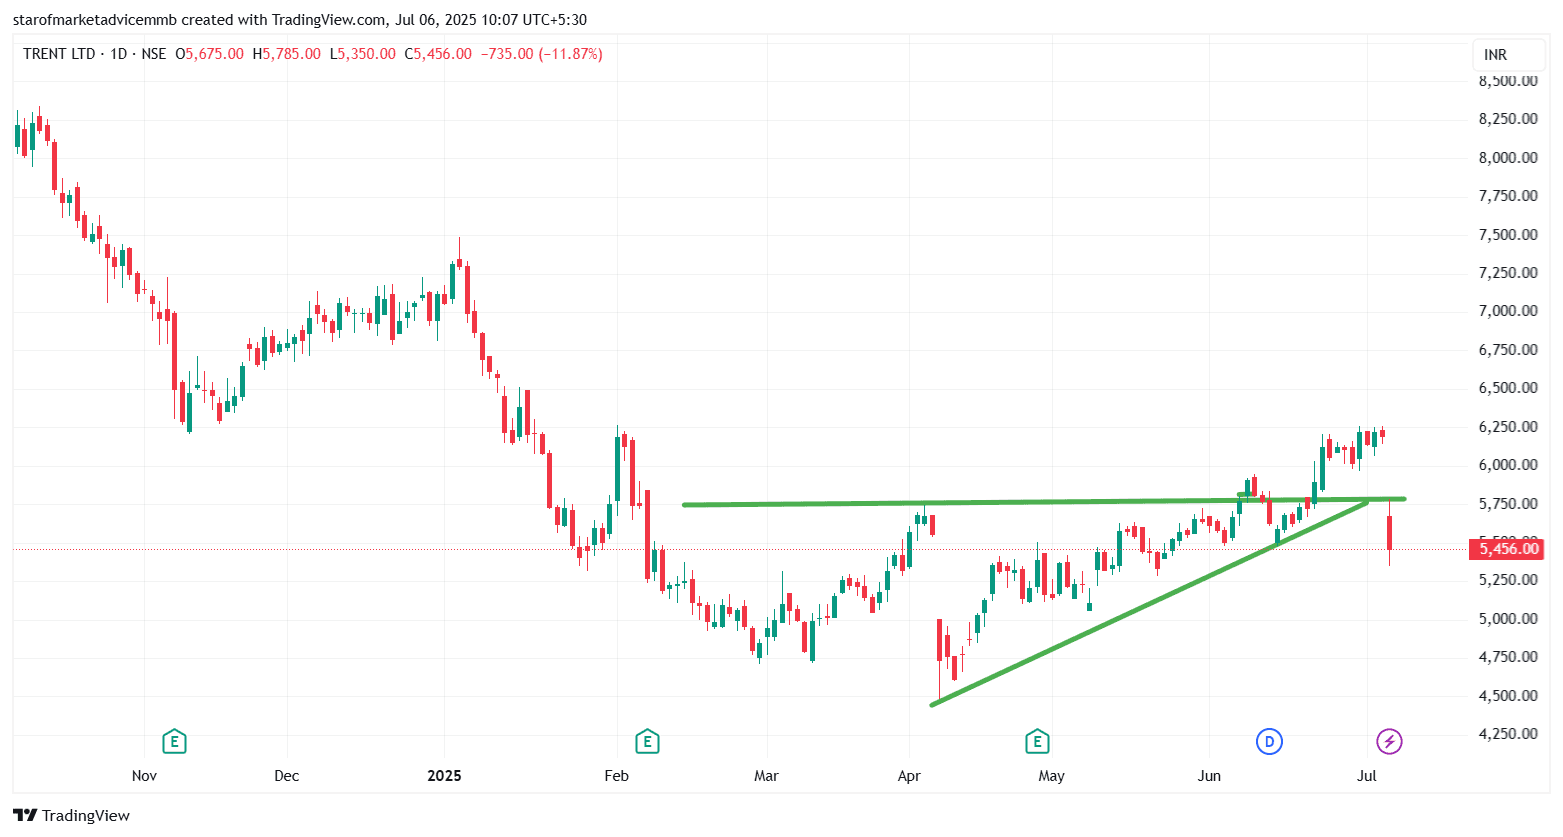
TRENT Chart Breakdown Summary:
The chart shows a rising wedge / ascending triangle pattern, which broke down sharply today with a heavy red candle.
Support Zone Broken: Price broke below the ₹5,750–₹5,800 breakout retest zone and previous horizontal resistance, which now acts as a failed support.
Volume Analysis (assumed): Such steep moves typically indicate strong distribution or long unwinding post a bull trap.
#TechnicalViews#FundamentalViews
1,131 likes·68 comments