


9th Mar 2025 · SEBI-Registered Analyst
STAROFMARKET ADVICE with MAYANK (SEBI RA) · 9th Mar 2025
Zomato
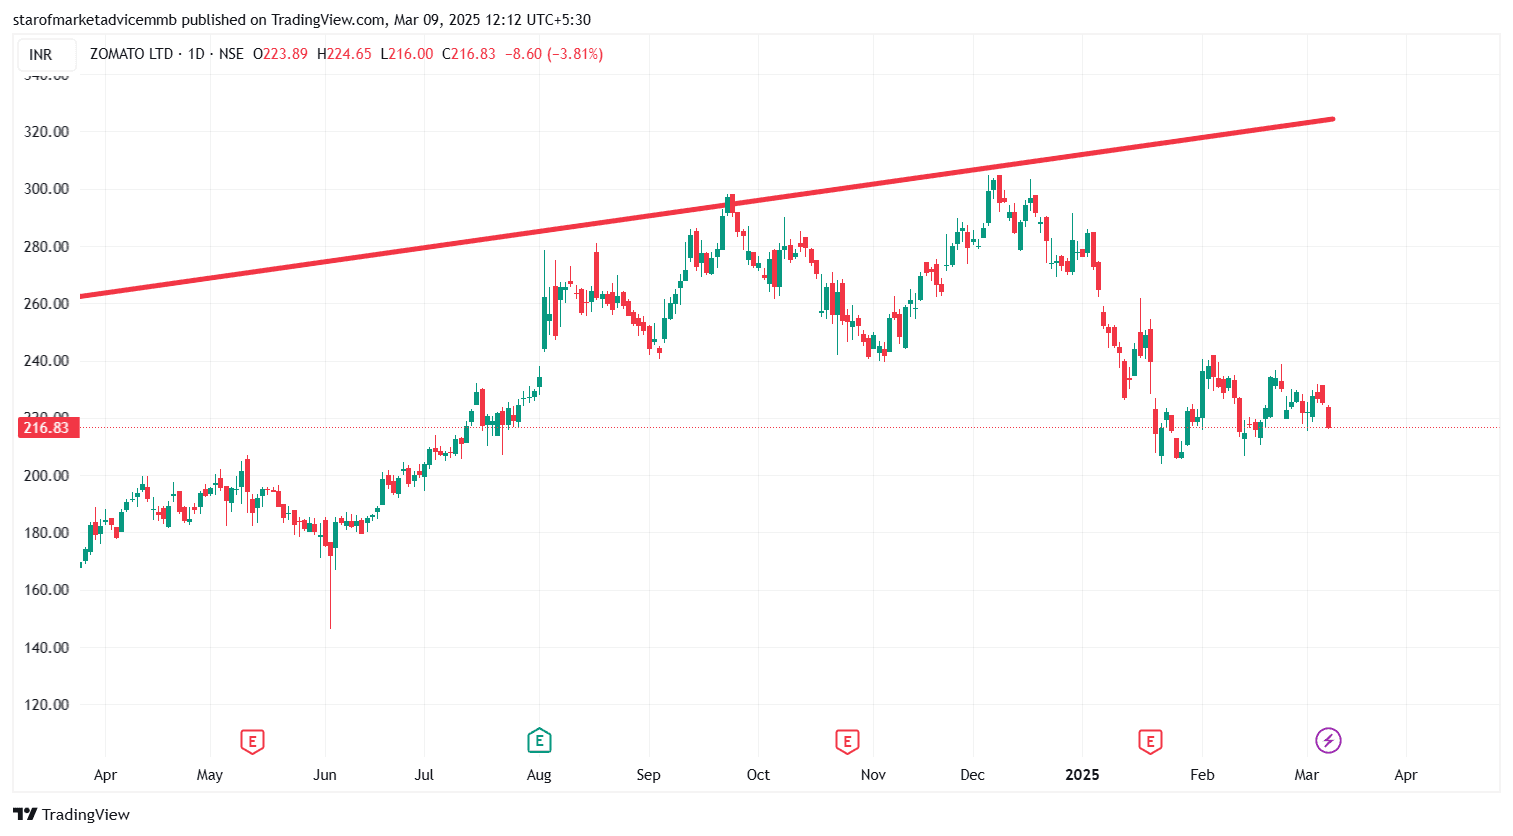
ZOMATO Stock chart is perfect example of how trendline resistance line works A trendline resistance line is a diagonal line drawn on a price chart that connects multiple high points and acts as a barrier preventing the price from rising further. It is used in technical analysis to identify areas where selling pressure might increase, causing the price to reverse or consolidate.
#StockInNews#Today’sTradingSetup#TechnicalViews#HiddenGems#TrendingSectors
219 likes·61 comments