



technical analysis of grindwell ltd
Stock name: GRINDWELL Ltd.
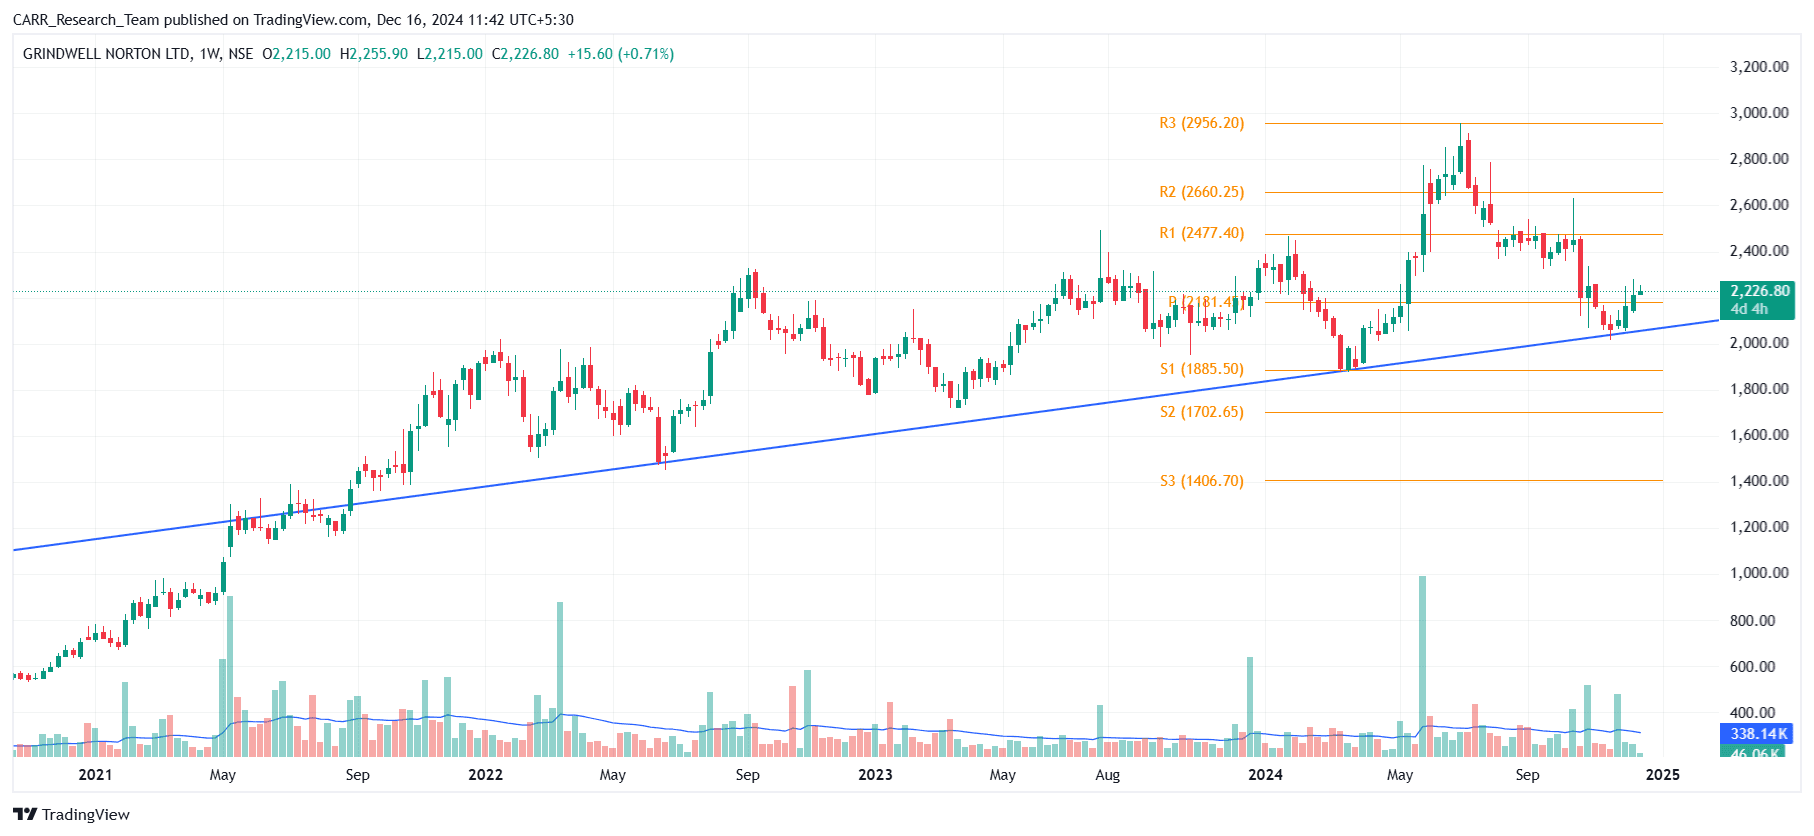
Pattern: Support and reversal
Time frame: Weekly
Observation:
The stock has maintained an overall uptrend, forming an inclined support line on the weekly chart from August 2021 to December 2024. It has repeatedly rebounded from this support, most recently in late November 2024, after cooling off from its ATH since July 2024. This rebound, supported by strong trading volume, has led to an upward movement. According to technical analysis, if the current momentum sustains, the stock may witness further upward progress. It's advisable to look for additional confirmations, such as RSI levels and the MACD indicator.
#WatchOutFor#StockInNews#IndexStrategies#Today’sTradingSetup
157 likes·48 comments