



Technical Analysis of MAHSEAMLES
Stock name: MAHSEAMLES s Ltd.
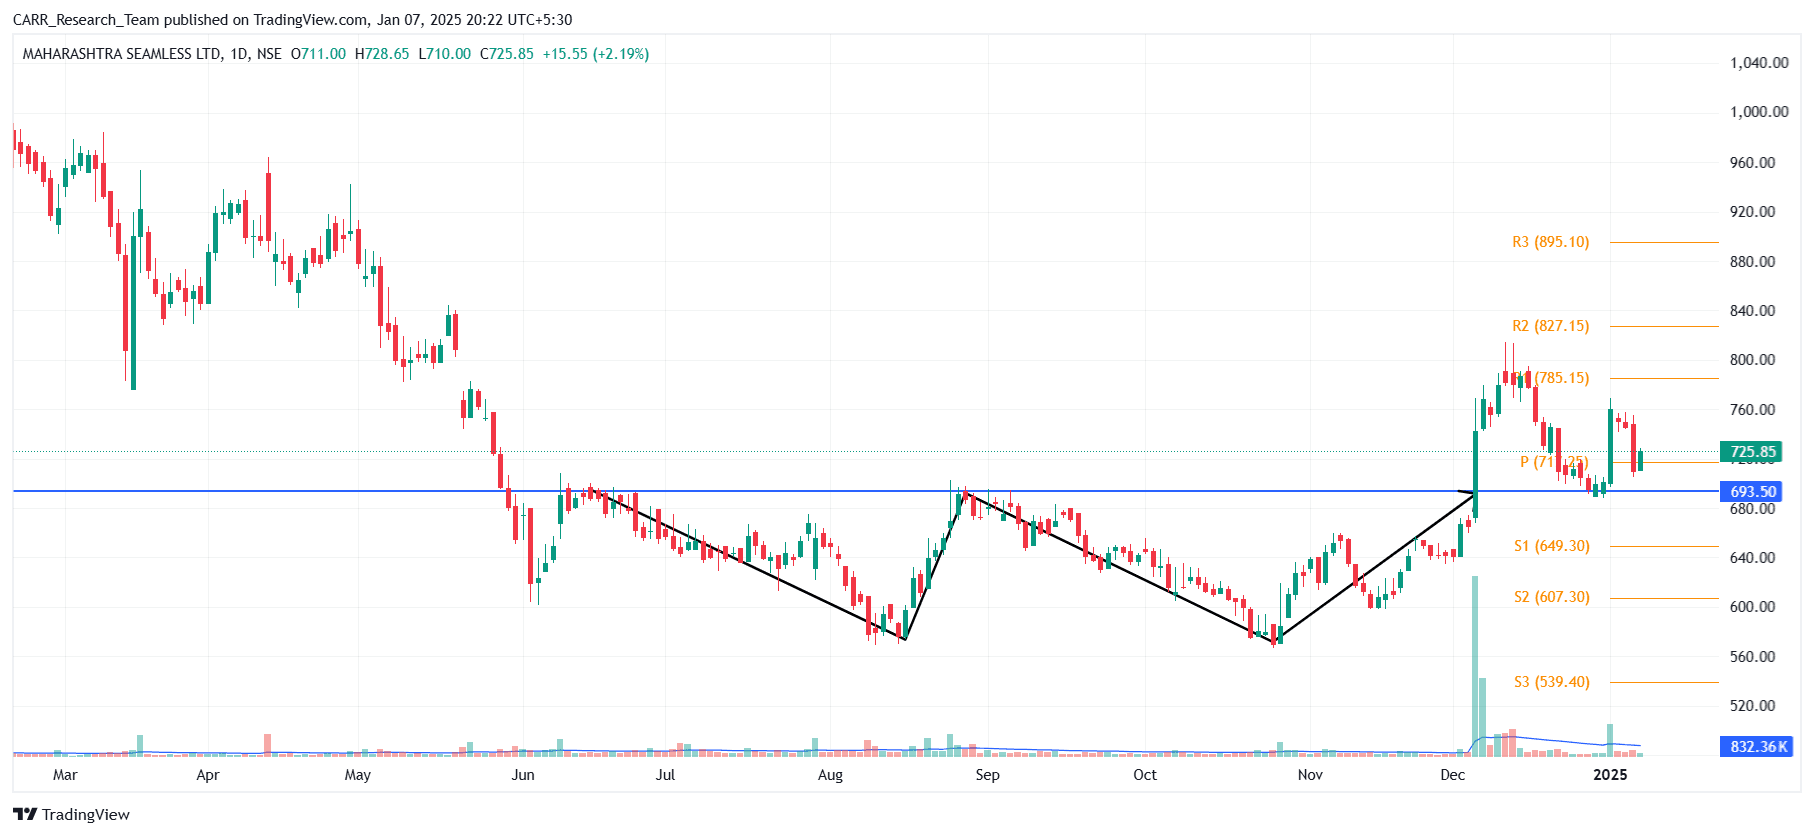
Pattern: Double bottom pattern and retest
Time frame: Daily
Observation:
The stock has been in a downtrend since January 2024 but formed a double bottom pattern on its daily chart from June to December 2024. In early December 2024, it registered a significant breakout with strong trading volume. Subsequently, the stock retested the breakout level and rebounded with good volume on January 1, 2025. According to technical analysis, if the rebound momentum continues, the stock may see further upward movement. It's advisable to look for additional confirmations, such as RSI levels and the MACD indicator.
#TechnicalViews#Post-ClosingCommentary#TrendingSectors#TimeToExit#PsychologyofMoney
283 likes·66 comments