Dr. Reddy’s Laboratories – Technical Outlook
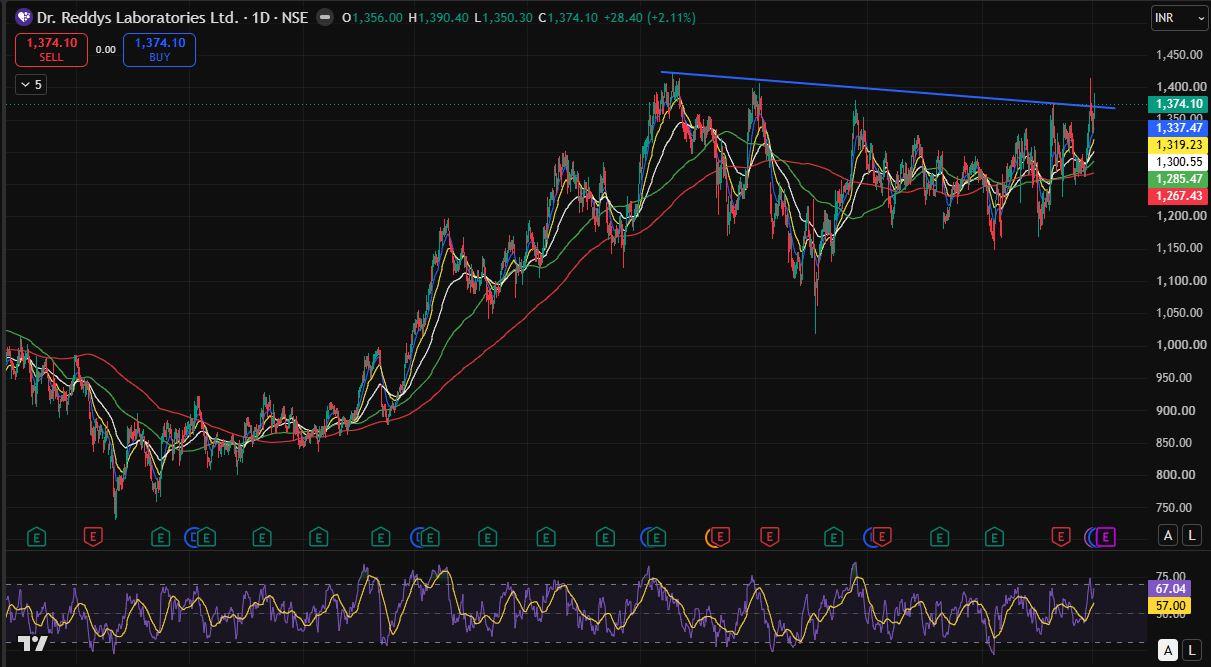
Dr. Reddy’s Laboratories has delivered a strong breakout after closing above a long-term descending trendline that had capped the stock’s upside for several months. The breakout was accompanied by a bullish candle and a close near the day’s high, indicating strong buying interest. The stock is also trading comfortably above its 10, 20, 50, 100, and 200-day moving averages, reflecting a healthy medium- to long-term uptrend and improving market sentiment.
Momentum indicators further support the positive outlook. The RSI is around 67, moving higher without entering extreme overbought territory, suggesting that bullish momentum remains intact. The alignment of short-term moving averages above the longer-term averages also indicates that buyers continue to dominate the trend.
From a price action perspective, the breakout above the trendline could trigger fresh upside if the stock sustains above the ₹1,370–1,380 zone. A decisive close above this level may open the door for a move towards ₹1,420, followed by ₹1,460–1,500 in the coming weeks. However, as the stock has rallied sharply in recent sessions, some short-term consolidation or profit booking around current levels cannot be ruled out before the next leg of the uptrend.
On the downside, ₹1,335–1,320 is likely to act as the first support, followed by the stronger support zone near ₹1,285, where the 100-day moving average is placed. As long as the stock remains above these support levels, the overall technical structure is expected to stay positive. Traders may continue to maintain a bullish bias while investors can watch for sustained strength above the breakout zone for further confirmation of the ongoing upward trend.