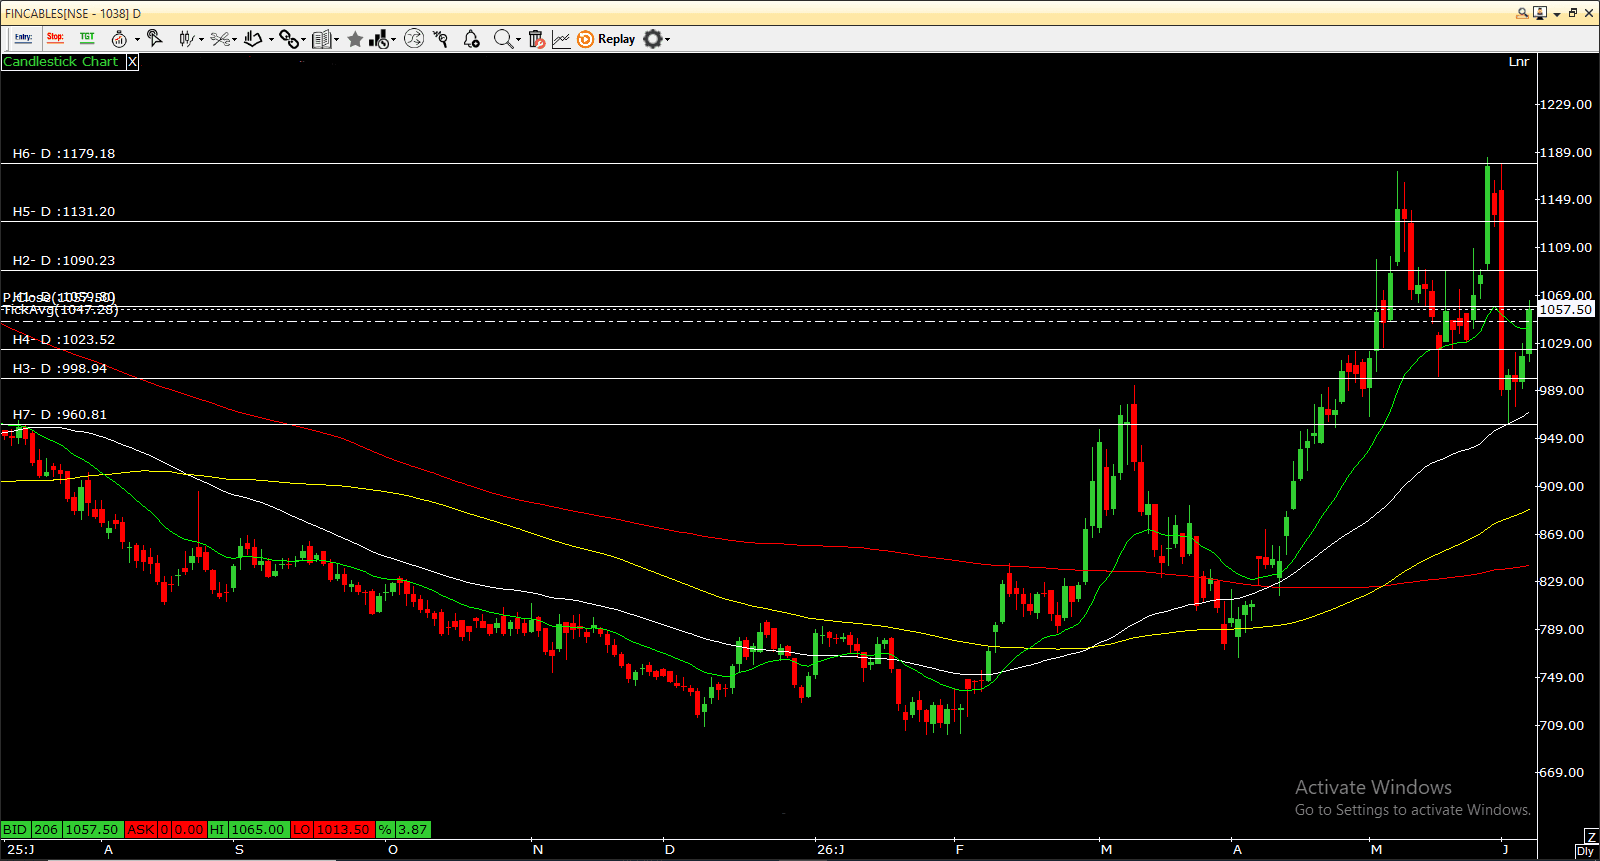
Fincables Ltd. – Technical Outlook
Fincables is showing a strong bullish structure on the daily chart. After a prolonged consolidation and downtrend phase, the stock has staged an impressive recovery and is now trading above its 20-day, 50-day, and 100-day moving averages, indicating a positive medium-term trend. The stock recently witnessed a healthy pullback from higher levels and found support around the ₹990 zone before rebounding sharply. This recovery suggests that buying interest remains strong at lower levels. The overall price structure continues to form higher highs and higher lows, which is a key characteristic of an uptrend. On the upside, the immediate hurdle is placed around ₹1,131, followed by a major resistance near ₹1,179. A sustained move above ₹1,131 could attract fresh momentum buying and open the door for a retest of ₹1,179 and potentially the ₹1,230 zone. On the downside, ₹1,058–₹1,024 acts as an important support area. As long as the stock remains above this zone, the bullish outlook remains intact. A break below ₹1,024 could trigger profit booking and drag the stock towards the next support levels around ₹999 and ₹961. Key Levels Trend: Bullish Immediate Support: ₹1,058 Major Support: ₹1,024, ₹999 Immediate Resistance: ₹1,131 Major Resistance: ₹1,179, ₹1,230 Outlook The overall technical setup remains constructive, with buyers continuing to dominate at lower levels. Traders may consider a “buy-on-dips” approach while the stock holds above ₹1,024. A decisive breakout above ₹1,131 could strengthen bullish momentum and lead to a fresh leg of the uptrend in the coming sessions. Overall, the stock remains favorably positioned for further upside as long as key support levels are protected. $FINCABLES