$FORTIS - CHART ANALYSIS
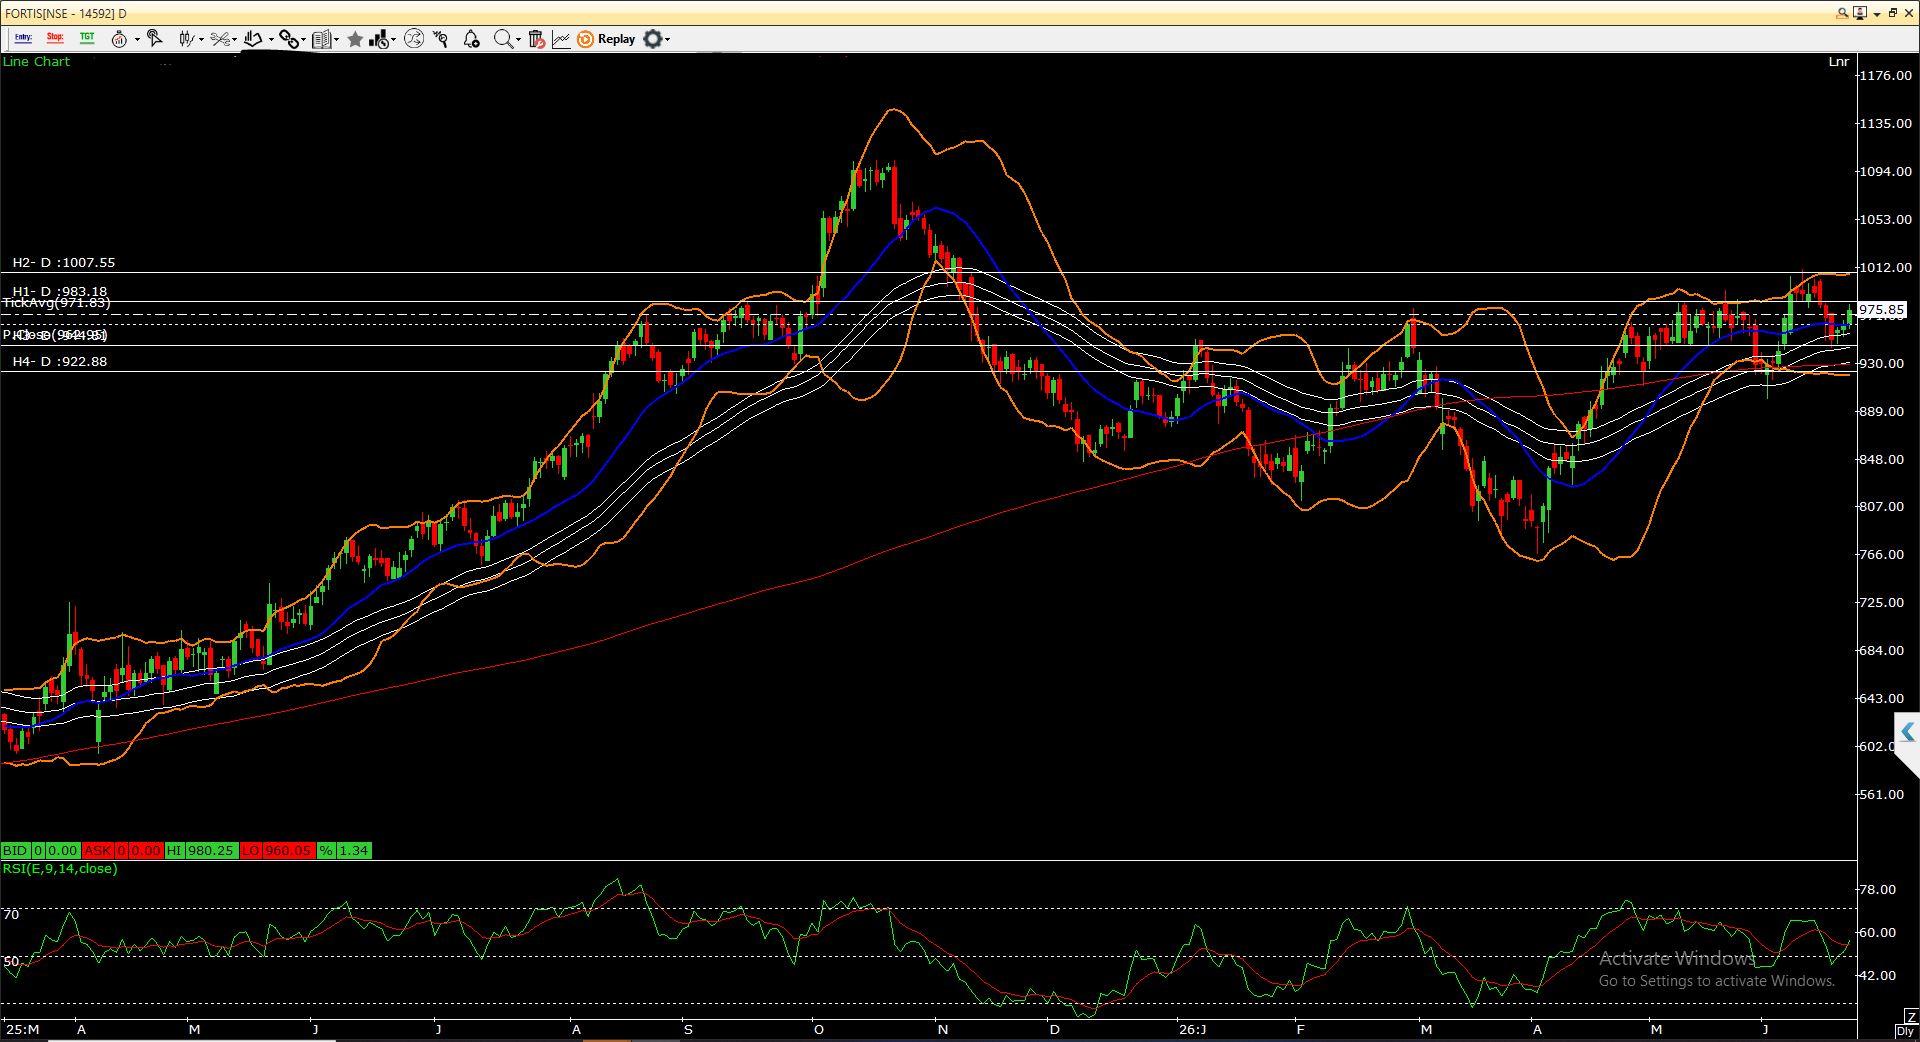
The stock continues to maintain a positive intermediate-term structure, trading above its 200-day moving average while consolidating near a key resistance zone of 980–1000. After a strong rally from lower levels, the recent price action indicates healthy profit booking rather than a trend reversal. Buyers have consistently defended the 930–950 support zone, suggesting accumulation on declines. The 50-day moving average is trending higher and remains above the 200-day moving average, reflecting an overall bullish bias. Price is currently hovering around the short-term moving averages, indicating consolidation before the next directional move. Bollinger Bands have narrowed after recent volatility, hinting that a fresh expansion in price could follow once a breakout occurs. The RSI has recovered from lower levels and is moving around the 55–60 zone, indicating improving momentum without entering overbought territory. This leaves room for further upside if buying interest strengthens. On the upside, a decisive close above 985–1000 can trigger fresh momentum, opening the door towards 1015 and then 1040–1050. However, failure to sustain above this resistance may result in continued range-bound movement. Overall, the broader trend remains constructive as long as the stock holds above the 930–940 support zone. Traders may look for fresh long positions on a convincing breakout above 1000, while investors can continue to maintain a positive bias with a stop below the key support area.