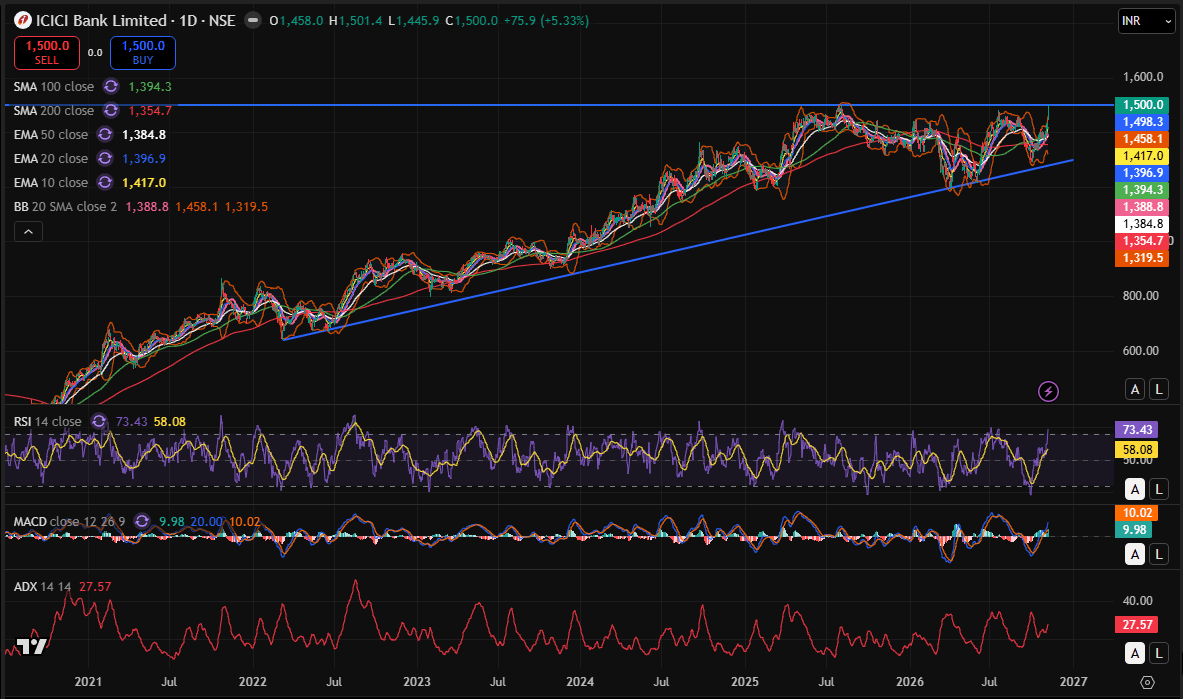
ICICI Bank Ltd : Is a Major Breakout Ahead?
ICICI Bank witnessed a strong bullish move, gaining 5.33% to close at ₹1,500, bringing the stock right up to a crucial resistance zone. The sharp green candle indicates strong buying interest and improving market sentiment. Technical Analysis: The stock continues to maintain its long-term bullish structure, trading comfortably above its 20 EMA (₹1,396.9), 50 EMA (₹1,384.8), 100 SMA (₹1,394.3) and 200 SMA (₹1,354.7). This alignment reflects underlying strength across multiple timeframes. The immediate challenge is the ₹1,500 resistance zone. A sustained breakout above this level could open the door for further upside. Momentum indicators are also encouraging: RSI: At 73.43, indicating strong bullish momentum, although the stock is entering overbought territory. MACD: Positive, reflecting improving momentum. ADX: At 27.57, suggesting a strengthening trend. Key Levels to Watch: Resistance: ₹1,500–1,520 Support: ₹1,458, followed by ₹1,417 and ₹1,395. My View: ICICI Bank is showing strong bullish momentum, supported by a positive moving-average structure and improving technical indicators. However, traders should watch for a decisive close above ₹1,500–1,520 to confirm a fresh breakout. Any failure to sustain higher levels could invite short-term profit booking. Disclosure: The analyst does not have any position in the stock, and his family does not have any position in the stock. This is an educational technical analysis, not investment advice. ICICIBANK