1 hour ago · SEBI Registration INH000019309
SEBI Registration INH000019309 · 1 hour ago
Indus Towers: A Potential Trend Reversal on the Charts?
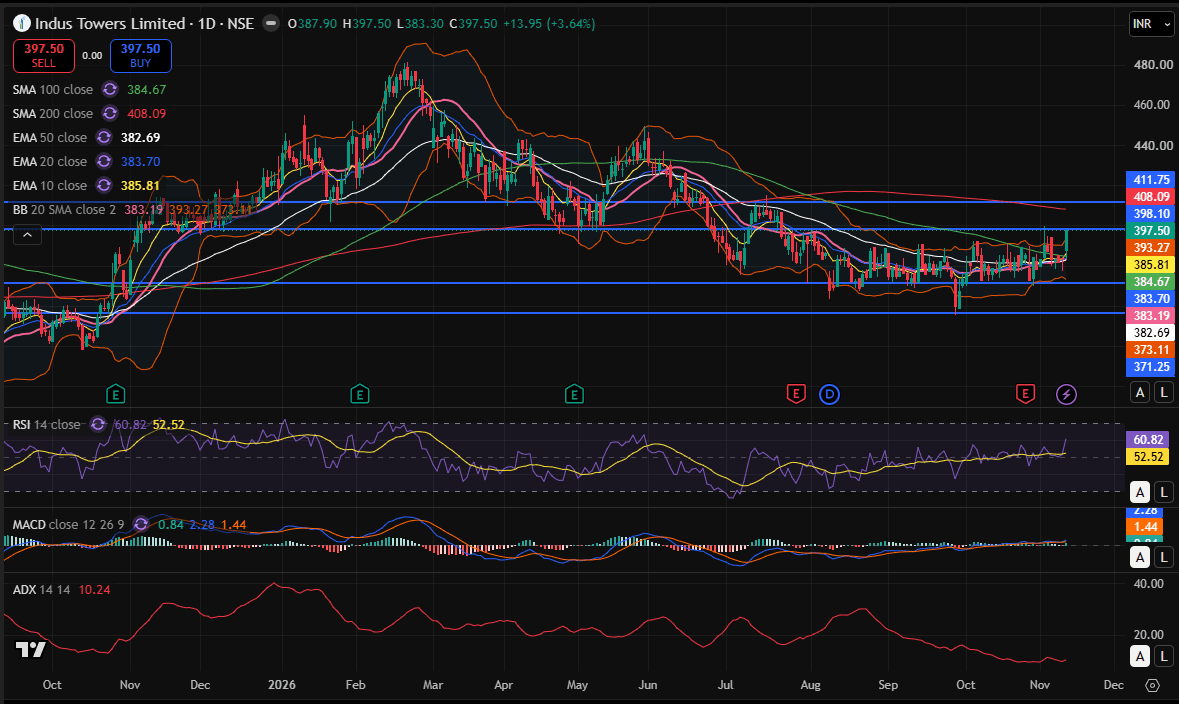
Indus Towers jumped 3.64% to close at ₹397.50, showing fresh buying interest after several months of sideways movement. The stock is now approaching an important resistance zone, making the next few trading sessions crucial. Technical View Indus Towers is showing signs of improving strength after a prolonged consolidation phase. The stock has moved above its important short and medium-term moving averages, suggesting that buying interest is gradually returning. RSI has crossed 60, indicating positive momentum, while MACD is also supporting the bullish setup. However, the stock is facing resistance around ₹398–400. A sustained move above this zone could attract fresh buying and potentially take the stock towards ₹408–412. On the downside, ₹383–385 remains an important support area. Interestingly, the ADX is still near 10, suggesting that the overall trend is not yet very strong. Therefore, a breakout with good volumes will be important for further upside confirmation. Key Levels to Watch Resistance: ₹400, ₹408–412 Support: ₹383–385, ₹371–373 My View The technical structure is gradually improving, but the stock is standing at a crucial resistance zone. A decisive breakout above ₹400 could open the door for further upside, while failure to cross this level may lead to continued consolidation. Disclosure: The analyst and his family do not have any position in the stock. Disclaimer: This article is for educational purposes only and should not be considered investment advice. INDUSTOWER