16 mins ago · SEBI Registration INH000019309
SEBI Registration INH000019309 · 16 mins ago
Kalyan Jewellers Breaks Downtrend: What Next?
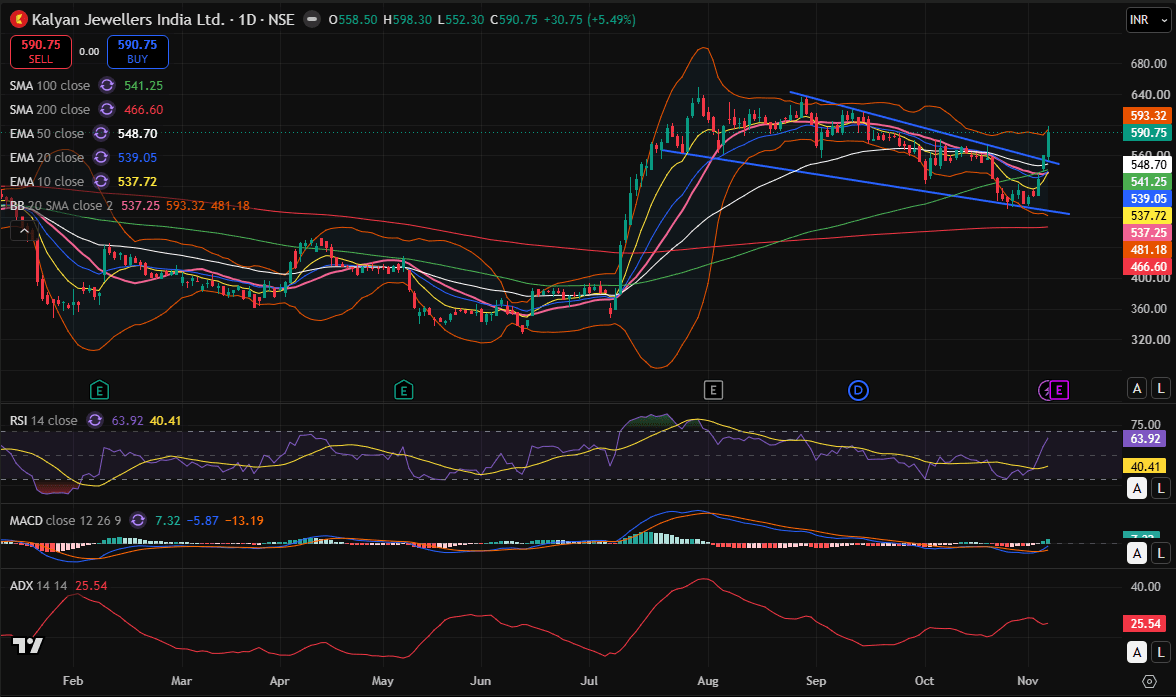
Kalyan Jewellers India Ltd. witnessed a strong buying session, gaining 5.49% to close at ₹590.75. The stock has shown a promising technical recovery, with a potential breakout from its short-term downward-sloping trendline. Technical View: The stock has moved above its key moving averages, including the 10 EMA (₹537.72), 20 EMA (₹539.05), 50 EMA (₹548.70) and 100 SMA (₹541.25), indicating improving bullish momentum. The RSI has surged to 63.92, suggesting strengthening buying interest without entering the overbought zone. MACD is showing signs of a bullish turnaround, while ADX at 25.54 indicates a developing trend. The stock is also approaching the upper Bollinger Band near ₹593.32, making this an important near-term resistance zone. Key Levels: Immediate Resistance: ₹593–600 Next Resistance: ₹615–625 Immediate Support: ₹570 Strong Support: ₹548–540 My View: The sharp recovery, improving momentum indicators and move above key moving averages indicate that bullish sentiment is returning to Kalyan Jewellers. A sustained breakout above ₹600 could open the door for further upside. However, traders should watch for sustained buying volumes and confirmation above resistance before taking fresh positions. Disclosure: The analyst or his family does not have any position in the stock. Disclaimer: This article is for educational and informational purposes only and should not be considered investment advice. KALYANKJIL