2 hours ago · SEBI Registration INH000019309
SEBI Registration INH000019309 · 2 hours ago
Kross Limited: Bullish Momentum Strengthens
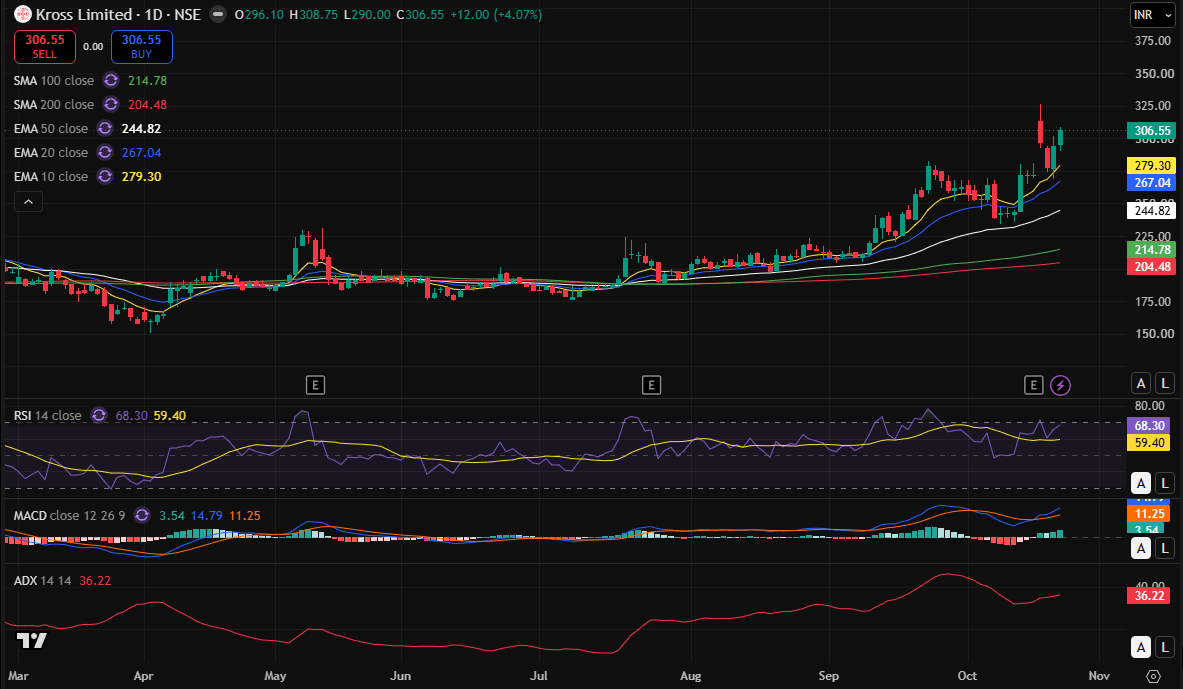
Kross Limited is maintaining a strong uptrend on the daily chart, forming a higher high–higher low structure. The stock is trading at ₹306.55, up 4.07% in the latest session, and remains comfortably above its key moving averages, indicating sustained buying interest.
The 20-day EMA at ₹267 has acted as an important dynamic support during recent corrections, while the 10-day EMA at ₹279.30 offers a nearer-term reference for trend strength. The stock's ability to sustain above these levels keeps the broader technical structure positive.
Momentum indicators are also supportive. The MACD line is above the signal line and the zero line, with positive histogram bars indicating improving bullish momentum. RSI stands at 68.30, reflecting strong buying pressure and approaching overbought territory. ADX at 36.22 suggests that the prevailing trend has considerable strength.
From a technical perspective, ₹310–₹315 is the immediate resistance zone, followed by ₹320–₹325. On the downside, ₹290–₹285 may act as near-term support, while the 10-day EMA near ₹279 is an important level to monitor if profit booking emerges.
My View: The overall chart structure remains bullish, but the stock is approaching a resistance zone after a strong rally. A sustained breakout above ₹315, supported by volume, could open the door for further upside. Failure to cross this zone may lead to consolidation or short-term profit booking. Existing investors can monitor the support levels and price-volume behaviour for signs of trend continuation or weakening momentum.
Disclosure: The analyst and his family do not have any position in the stock. This article is for educational purposes only and is not investment advice.