LAURUSLAB - Chart Analysis
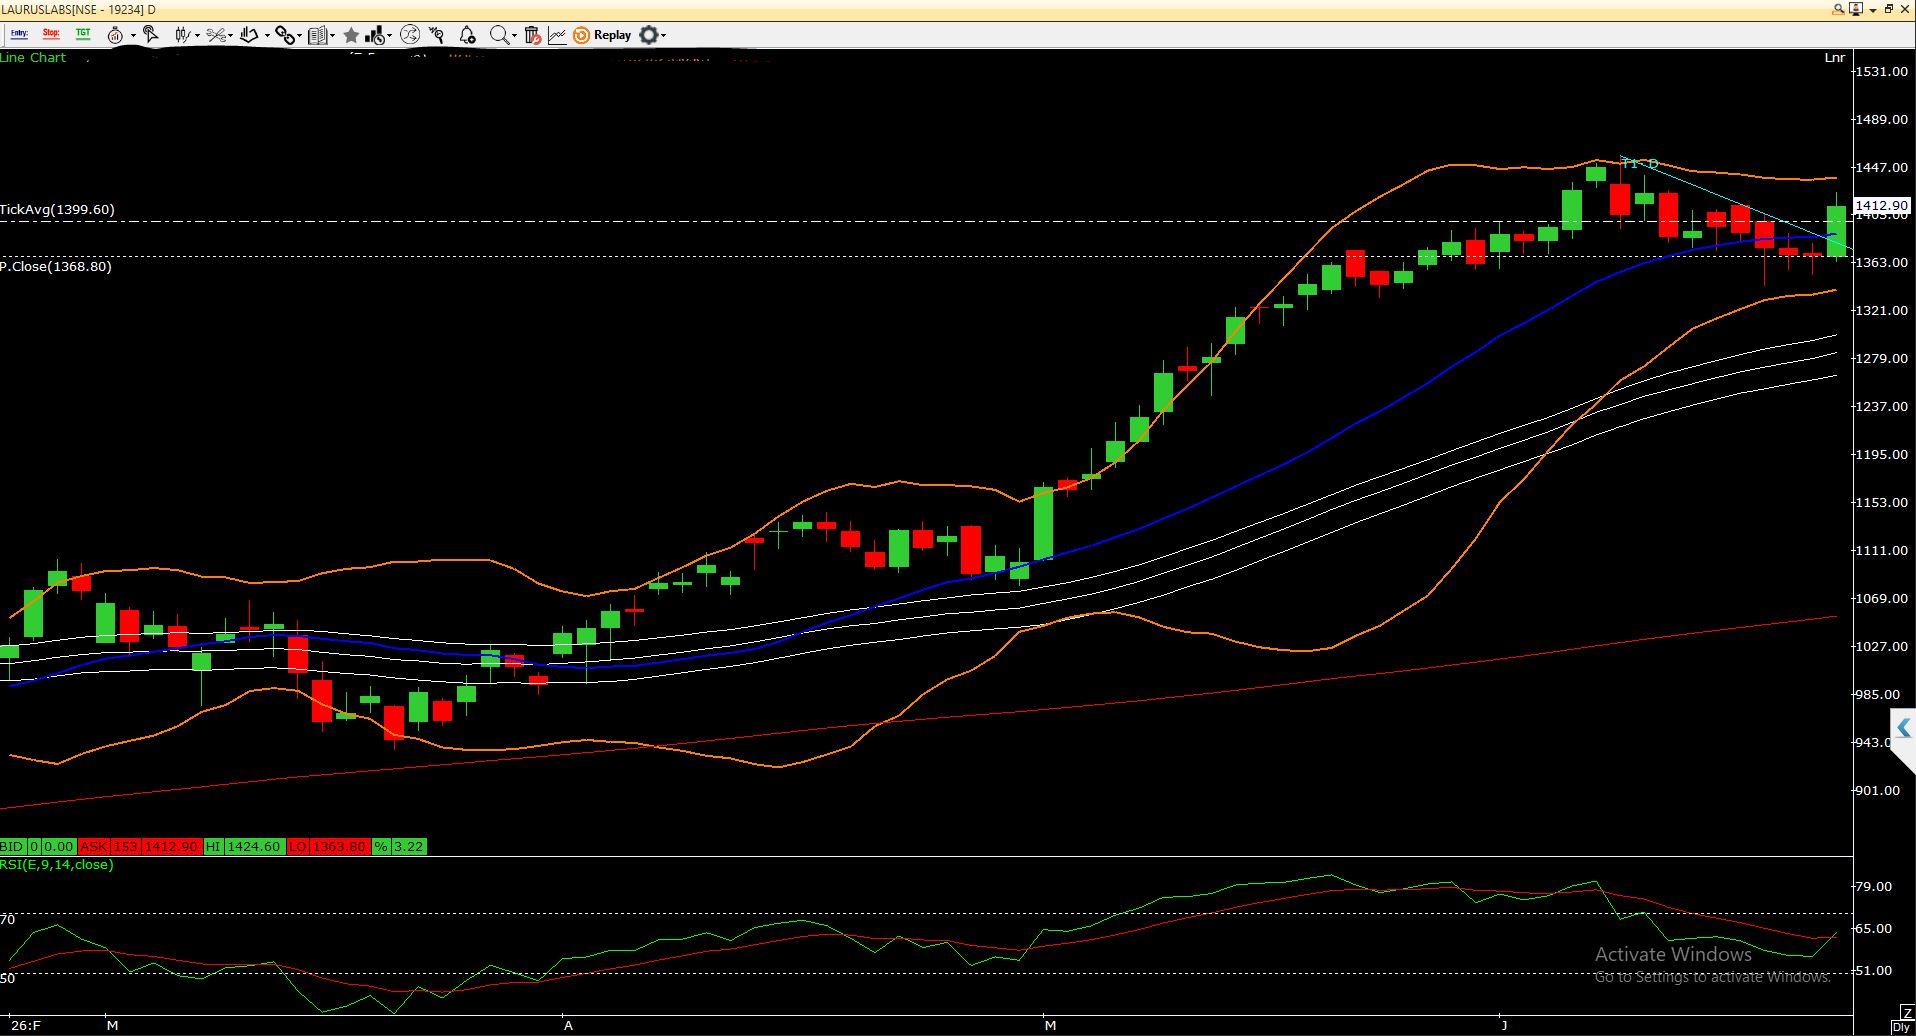
LAURUSLAB has been witnessing a strong primary uptrend, evident from the series of higher highs and higher lows over the past several months. The stock continues to trade comfortably above its 100-DMA and 200-DMA, reaffirming that the long-term trend remains firmly positive despite the recent consolidation. After rallying sharply towards the 1450 zone, the stock entered a healthy corrective phase and has been consolidating within a narrow range. It recently found support around the 50-EMA lower band near 1360–1380 and has formed a positive reversal candle, indicating that buying interest is emerging at lower levels. The 50-day EMA continues to slope higher, suggesting that the broader bullish structure remains intact. Momentum indicators also support a constructive outlook. RSI has cooled from overbought territory and is now turning higher from around the 60 level, indicating improving momentum without entering an overheated zone. The recent pullback appears to be a normal correction within the prevailing uptrend rather than a change in trend. Going forward, the 1380–1400 zone is expected to act as an attractive accumulation area for positional investors. As long as the stock sustains above the crucial support at 1322, the bullish bias is likely to remain intact. A sustained move above 1425–1450 could trigger the next leg of the uptrend, opening the door for fresh highs over the medium term, while a decisive close below 1322 would weaken the current positive outlook and warrant caution. $LAURUSLABS