2 hours ago · SEBI Registration INH000019309
SEBI Registration INH000019309 · 2 hours ago
Meesho Gathers Momentum: Time for the Next Rally?
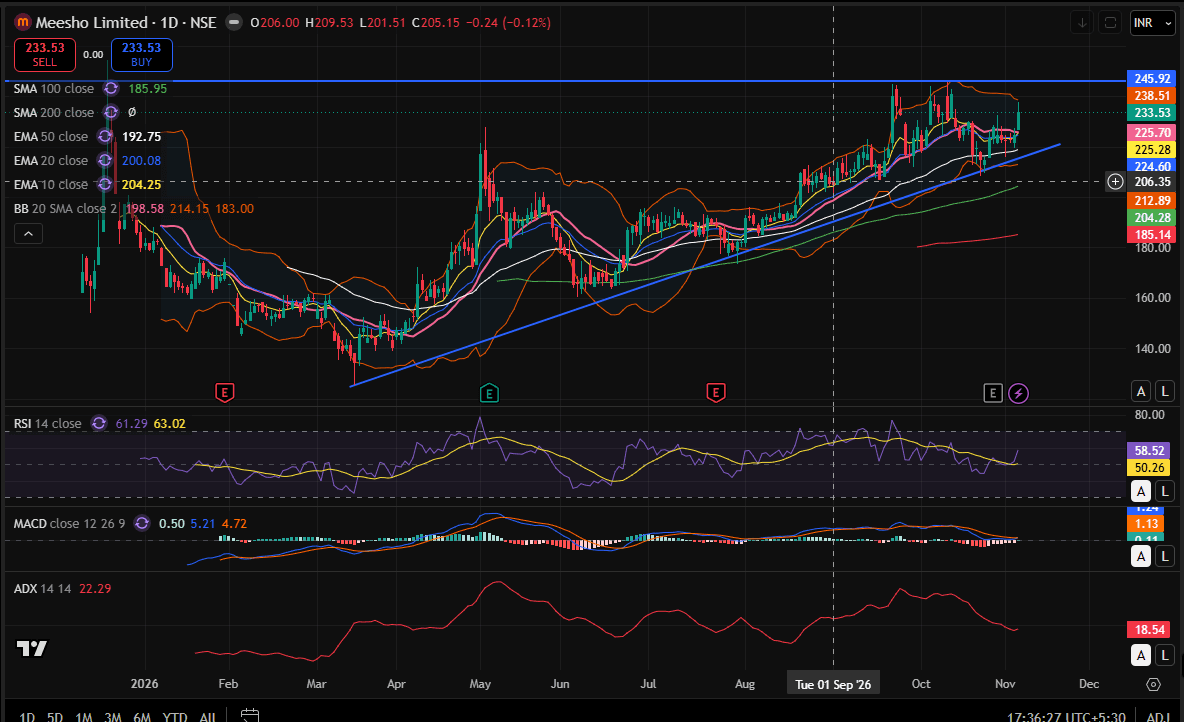
Meesho is showing signs of strength on the daily chart after recovering from its recent consolidation phase. The stock is currently trading around ₹233.53 and is holding above its rising trendline, indicating that the broader bullish structure remains intact. Technical Analysis The stock is trading above its key moving averages, including the 10 EMA, 20 EMA, 50 EMA and 100 SMA, reflecting a positive underlying trend. The rising trendline connecting previous swing lows is providing important support. The RSI is around 58.5, indicating improving bullish momentum without entering the overbought zone. MACD is showing signs of stabilisation, although a stronger bullish crossover and expanding histogram would provide additional confirmation. ADX near 18.5 suggests that the current trend is not particularly strong yet. Therefore, a decisive breakout with strong volumes will be important. Key Levels to Watch Immediate Resistance: ₹238–240 Major Resistance: ₹245–246 Immediate Support: ₹225–224 Next Support: ₹212–213 What Next? A sustained breakout above ₹240, supported by strong volumes, could open the possibility of a move towards ₹245–246 and potentially higher levels. On the downside, ₹224–225 is an important support zone. A breakdown below this level could weaken the short-term bullish structure and invite further profit booking. My View MEESHO remains technically positive, but the stock is approaching an important resistance zone. Traders should watch for a volume-backed breakout above ₹240 rather than anticipating the move. Until then, consolidation within the current range cannot be ruled out. Disclaimer: This article is for educational purposes only and should not be considered investment advice. Disclosure: The analyst does or his family does not have any position in the stock.