2 hours ago · SEBI Registration INH000019309
SEBI Registration INH000019309 · 2 hours ago
Mphasis: Breakout Confirmed or Resistance Ahead?
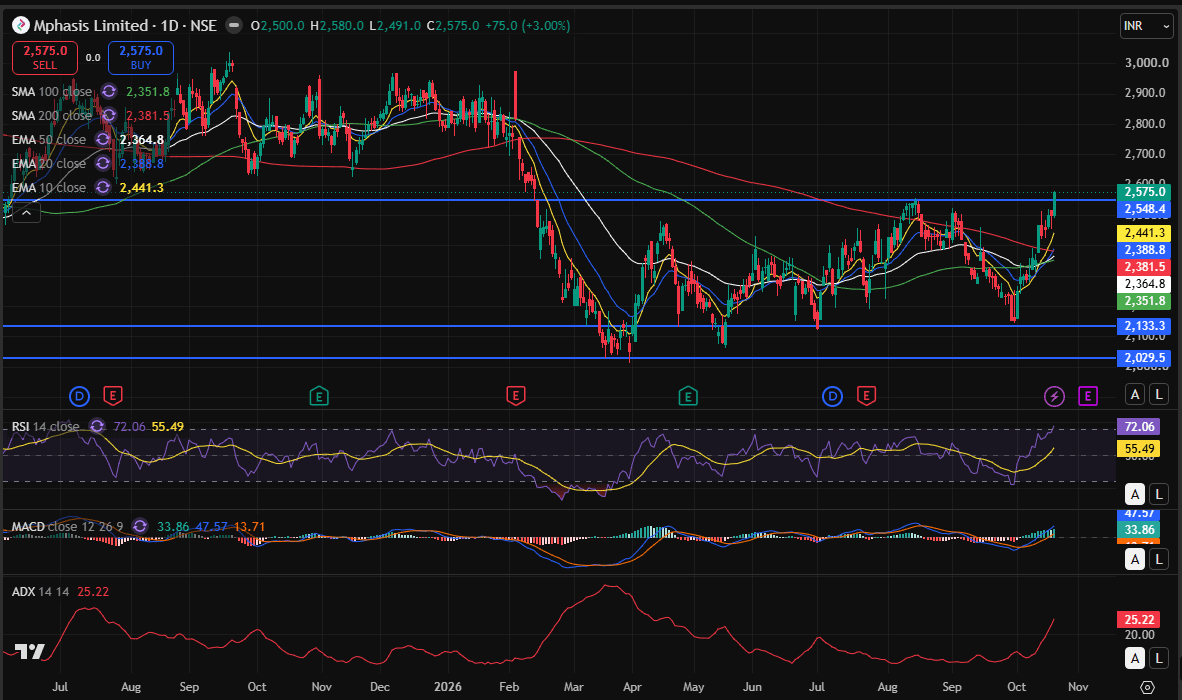
Mphasis Ltd is showing renewed bullish momentum on the daily chart, rising 3% to ₹2,575 and moving above its recent consolidation zone.
The stock has reclaimed its key moving averages, with the 10 EMA at ₹2,441, 20 EMA at ₹2,389, 50 EMA at ₹2,365, 100 SMA at ₹2,352 and 200 SMA at ₹2,381. This alignment indicates improving short-term strength.
The technical indicators are encouraging:
• RSI at 72 suggests strong momentum, although the stock is entering overbought territory.
• MACD is turning bullish, with positive momentum supporting the recent rally.
• ADX at 25.22 indicates that trend strength is improving.
The stock is now testing the ₹2,575–₹2,600 resistance zone. A sustained breakout above this area, supported by strong volume, could open the door for further upside. However, rejection near resistance may trigger profit booking or a retest of the ₹2,500–₹2,450 zone.
My View: The technical structure has improved significantly, but confirmation above resistance remains important. Existing holders may monitor breakout sustainability, volume and trailing risk levels rather than chasing the sharp rally.
Disclosure: The analyst and his family do not have any position in the stock at the time of writing.
Disclaimer: This article is for educational purposes only and should not be construed as investment advice or a recommendation to buy or sell securities.