Mphasis Limited: Price Near Support, What the Next?
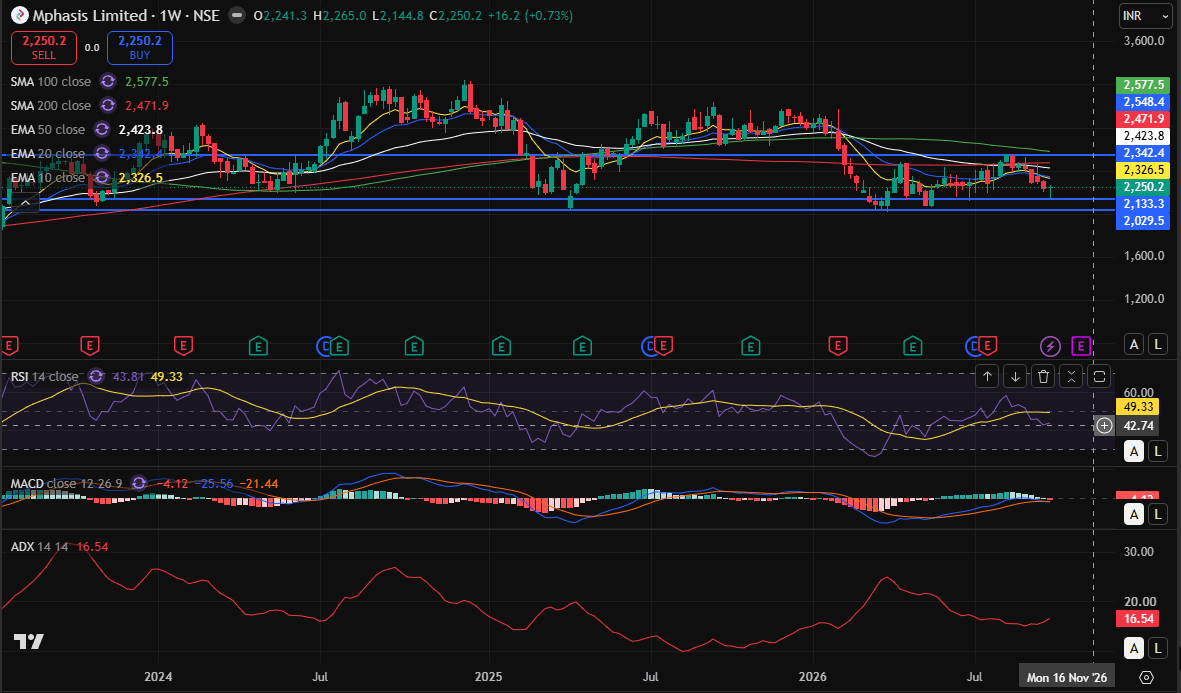
Mphasis Limited is currently trading around ₹2,250 on the weekly chart, after facing resistance near the ₹2,320–₹2,340 zone. The recent price action shows that the stock is still in a consolidation phase, with the ₹2,130–₹2,150 area emerging as an important support zone.
Technically, the stock is trading below its 10-week EMA (₹2,326), 20-week EMA (₹2,342), 50-week EMA (₹2,439) and 200-week SMA (₹2,472). This indicates that the broader trend has not yet turned convincingly positive.
Momentum indicators also remain cautious. RSI is around 44, below the 50 mark, suggesting that buying momentum is still relatively weak. MACD remains in negative territory, although the recent histogram movement indicates that downside momentum has moderated. ADX near 16 suggests that the current trend lacks strong directional strength and consolidation may continue.
For the near term, ₹2,130–₹2,150 is an important support zone. A sustained move below this area could bring ₹2,030 into focus. On the upside, ₹2,320–₹2,340 is the first important resistance zone. A decisive weekly close above this range could improve the technical setup, with ₹2,470 and then ₹2,575 becoming the next levels to watch.
My view is that Mphasis Limited is currently in a wait-and-watch phase. The stock needs to reclaim the ₹2,340 zone with sustained strength before the chart structure starts showing a meaningful improvement. Until then, consolidation between support and resistance remains possible.
Disclosure: This article represents my technical view based on the chart and is for informational purposes only. It should not be considered investment advice. Investors should conduct their own research or consult a SEBI-registered investment adviser before making any investment decision.