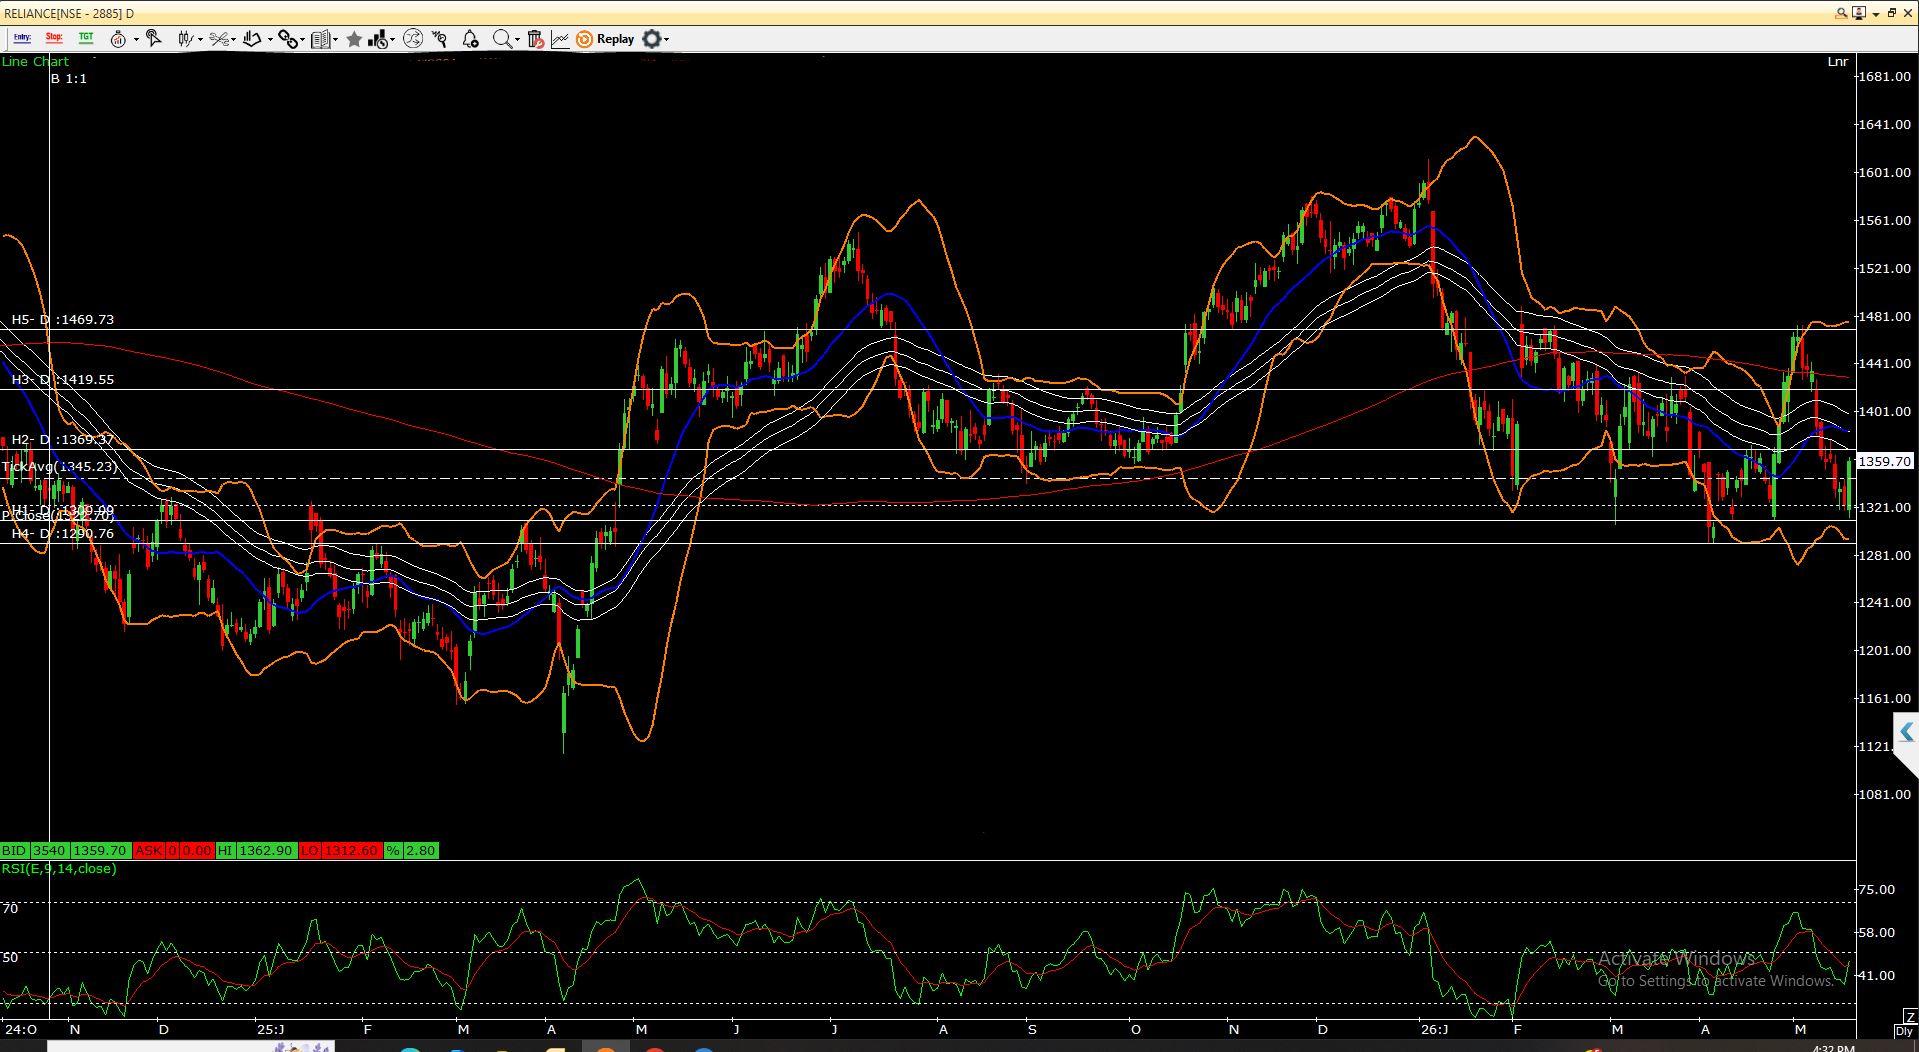
RELIANCE - OUTLOOK
The key observation on the daily charts of Reliance Industries is that the stock is attempting to stabilize after a corrective phase and is now showing signs of recovery from important support zones. The price has witnessed buying interest near the 1280-1300 region, which also coincides with earlier swing support and lower Bollinger Band levels, indicating strong base formation at lower levels. Technically, the stock is trading around the cluster of short-term moving averages, while the 200-day moving average near 1415-1420 is acting as an important resistance area. A sustained move above this zone can open the gates for further upside towards 1465 and then 1480 levels in the near term. A decisive breakout above 1480 may further strengthen the medium-term bullish structure. The RSI indicator is also showing improvement after rebounding from lower levels and is attempting to cross above the signal line, suggesting momentum is gradually turning positive. The formation of higher lows near support zones reflects accumulation at declines and improving market sentiment. Overall, the broader trend remains range-bound with a positive bias as long as the stock sustains above the 1280-1290 support zone on a closing basis. Traders may continue to adopt a buy-on-dips strategy while keeping a close watch on the 1415-1480 resistance band for the next directional breakout. $RELIANCE