$SIEMENS - Chart Analysis
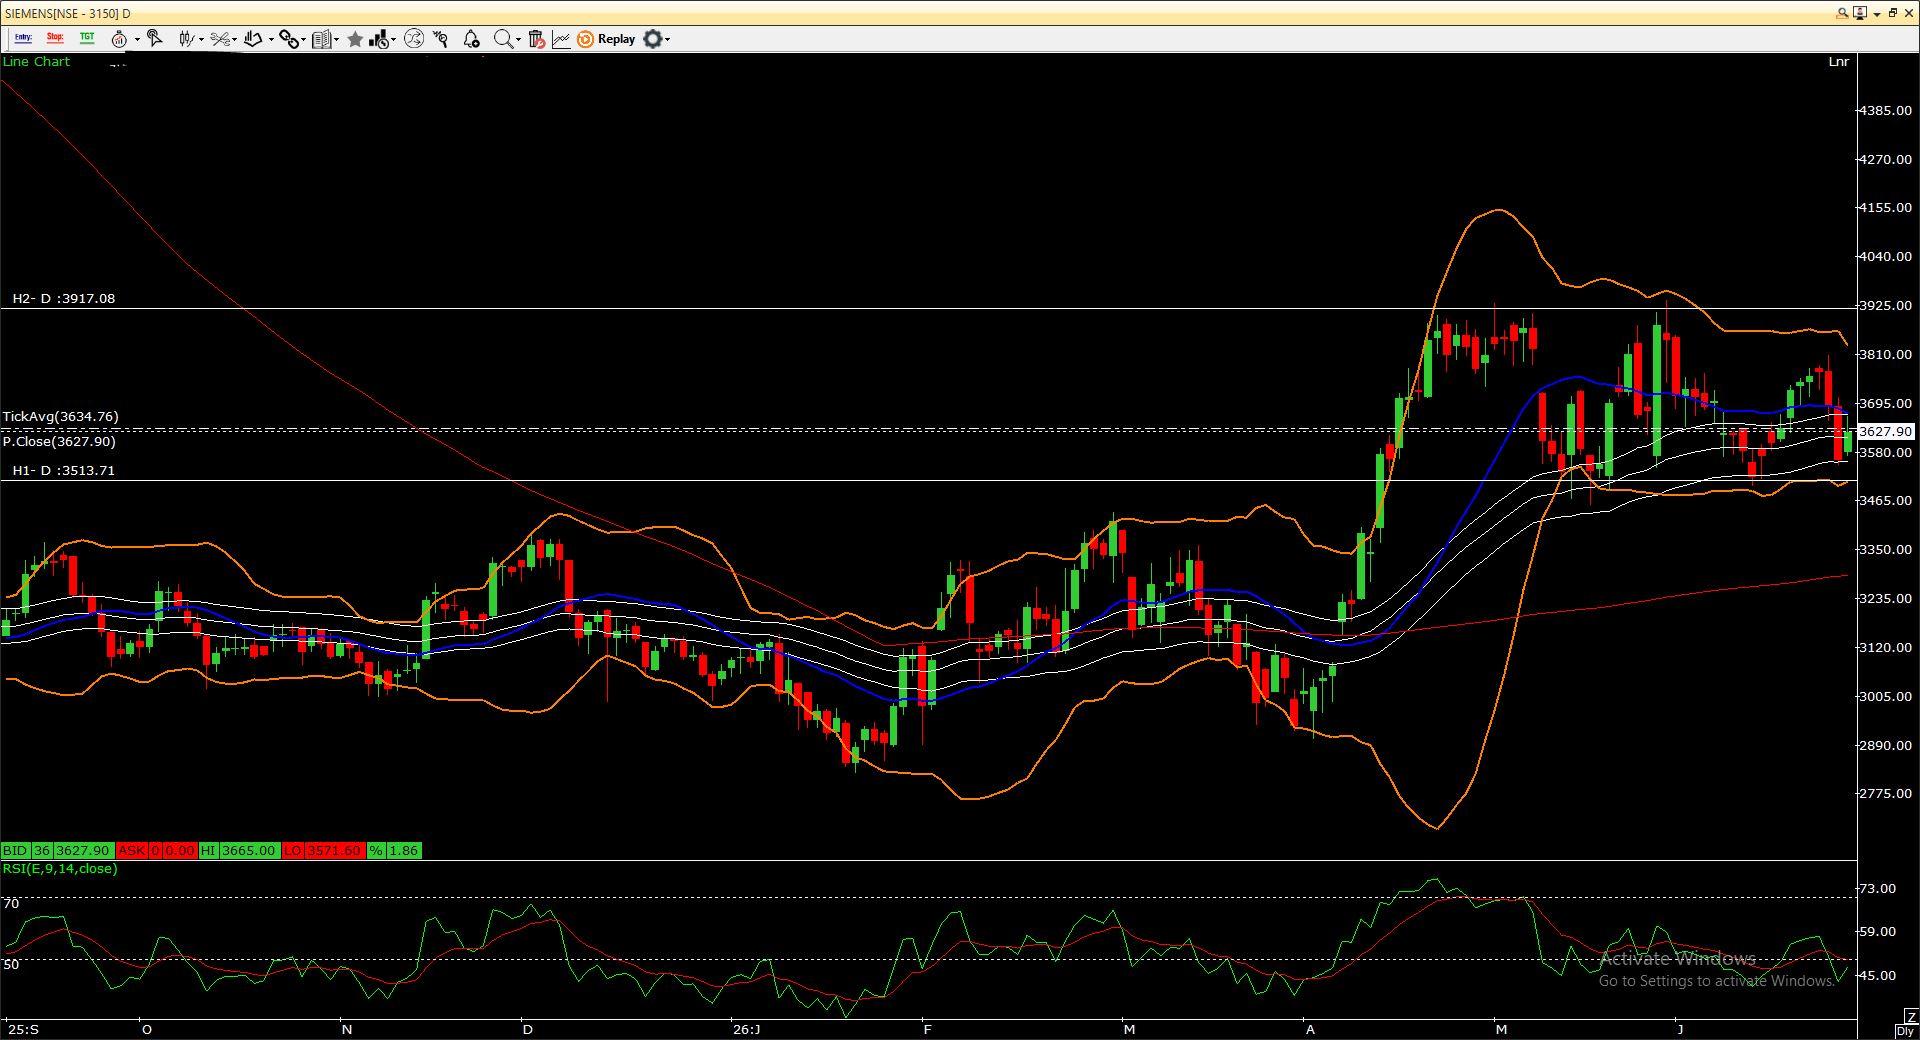
Siemens has witnessed a strong rally after breaking out above the long-term moving averages and is still trading well above its 200-day SMA, indicating that the broader trend remains positive. However, after the sharp upmove, the stock has entered a consolidation phase between the 3,510–3,920 zone, suggesting profit booking at higher levels while buyers continue to defend lower supports. Technically, the stock is currently hovering around its 50-day EMA, which is acting as an immediate support zone. The 20-day Bollinger Bands have narrowed, indicating reduced volatility and hinting that a directional move could emerge soon. RSI has cooled to around the neutral 45–50 zone after recovering from lower levels, reflecting the absence of strong momentum but also indicating that selling pressure is easing. On the upside, a sustained move above 3,700–3,750 can improve momentum and open the path towards 3,820 and then the major resistance near 3,920. A decisive breakout above 3,920 would confirm the continuation of the primary uptrend and could attract fresh buying interest. On the downside, 3,580–3,510 remains a crucial support zone. As long as the stock holds above this range, the broader bullish structure remains intact. However, a close below 3,510 could trigger fresh weakness and drag the stock towards the 200-day SMA near the 3,300 region. Overall, the long-term trend remains positive, but the stock is currently in a consolidation phase. Traders should watch for a breakout above resistance or a breakdown below support for the next meaningful directional move, while investors may continue to maintain a positive bias as long as key support levels remain intact.