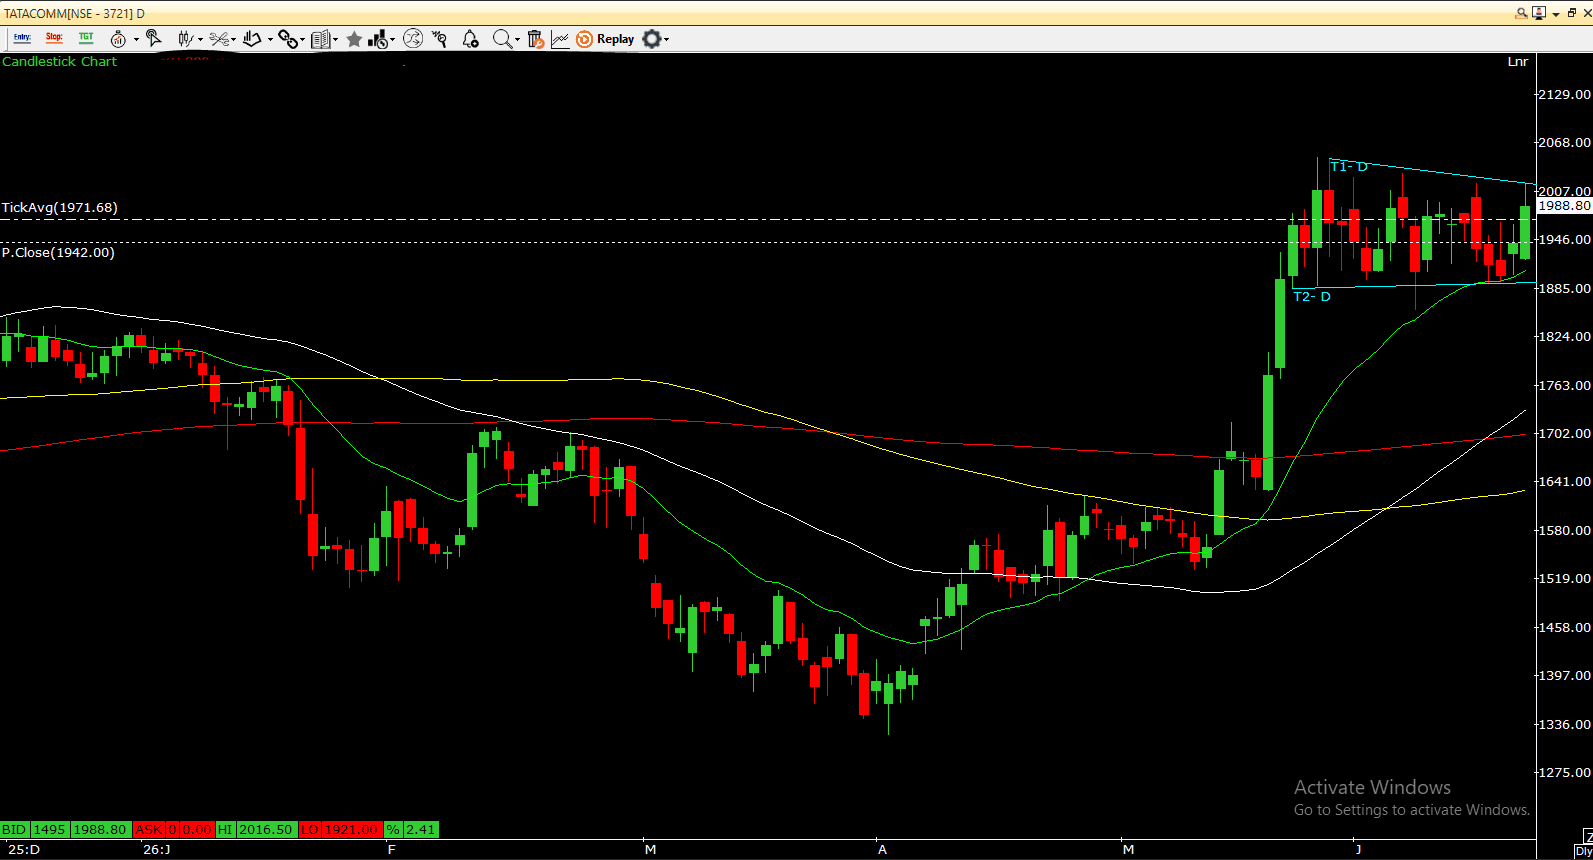
$TATACOMM - Chart Analysis
Tata Communications has witnessed a strong turnaround on the daily chart after spending several months in a consolidation phase. The stock has rallied sharply from the ₹1,550–1,650 zone and is currently trading near ₹1,990, indicating sustained buying interest. Price action remains comfortably above the 20, 50, 100 and 200-day moving averages, highlighting a strong bullish trend. After the recent surge, the stock appears to be forming a bullish flag pattern, a continuation setup that often develops after a strong upmove. The ongoing consolidation between ₹1,885 and ₹2,020 suggests healthy profit booking rather than weakness, allowing the stock to digest recent gains while maintaining its positive structure. The rising 20-day EMA near ₹1,900 is acting as an important support level, with buyers repeatedly stepping in on declines. As long as the stock sustains above the ₹1,885–1,900 zone, the broader trend is likely to remain favorable. On the upside, the ₹2,020–2,050 zone remains a crucial resistance area. A decisive breakout above this range would confirm the bullish flag pattern and could pave the way for a move towards ₹2,100 and higher levels in the coming weeks. Until then, some range-bound movement within the current consolidation zone cannot be ruled out. Overall, the chart structure remains constructive, with the recent consolidation appearing to be a pause within an ongoing uptrend rather than a reversal. Disclaimer: This analysis is for educational purposes only and should not be considered investment advice. Investors should consult their financial advisor before making any investment decisions.