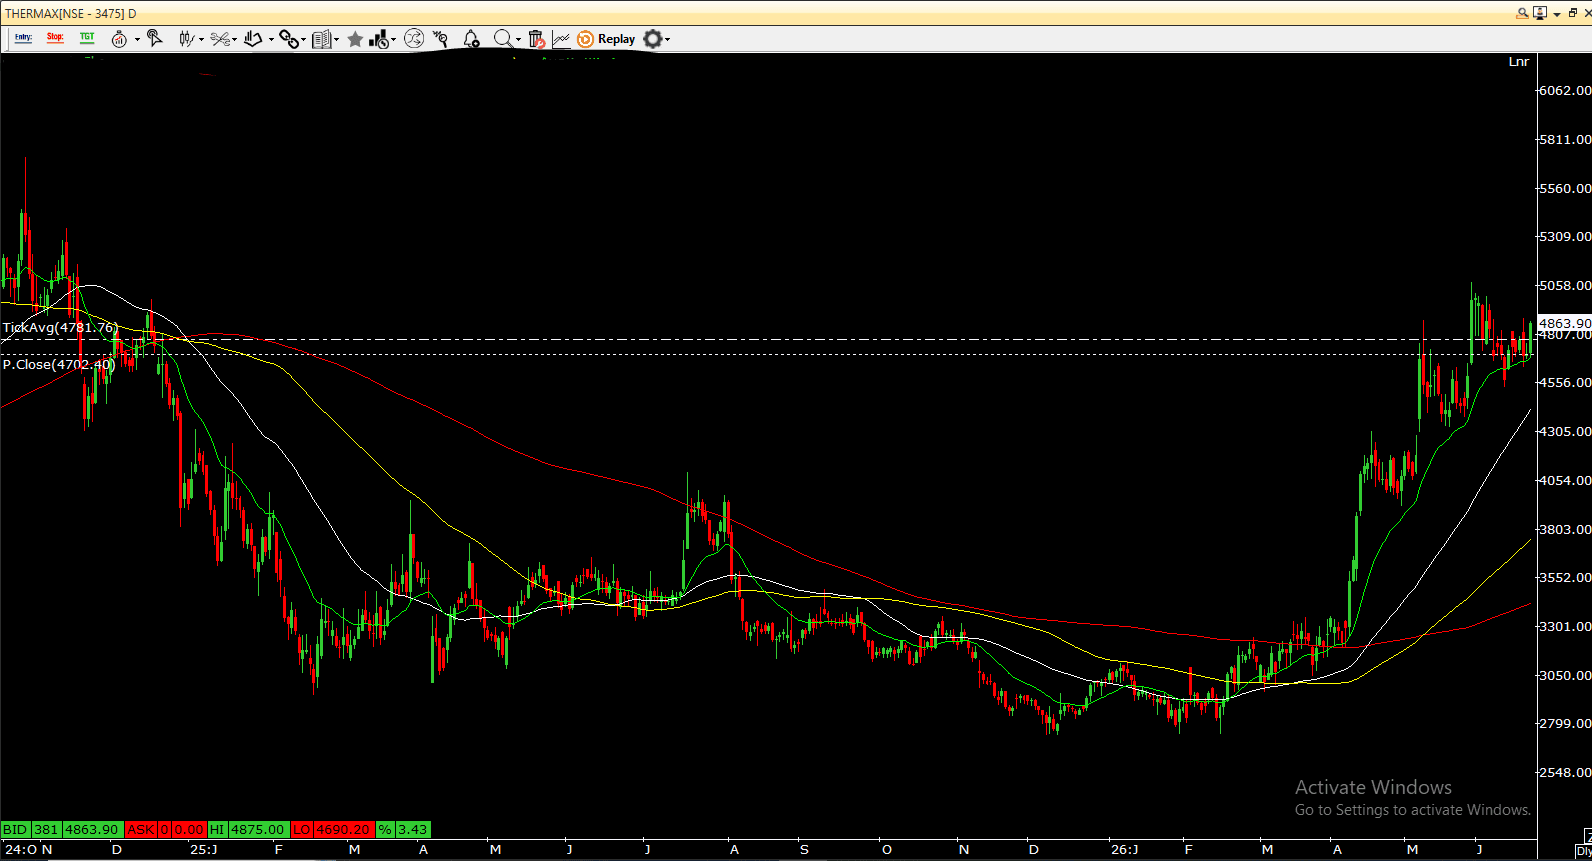
$THERMAX - IN A STRONG TREND
Thermax has shown a strong turnaround on the daily chart after forming a long-term base near the 2,800–3,000 zone. The stock witnessed a sharp breakout above its major moving averages and rallied strongly towards the 5,000 mark, indicating a clear shift in trend from bearish to bullish. Importantly, the price is trading above the 20 EMA, 50 SMA, 100 SMA, and 200 SMA, reflecting strength across short-, medium-, and long-term timeframes. After the recent rally, the stock has entered a consolidation phase between roughly 4,550 and 5,000. Such consolidation following a strong upmove generally indicates profit booking and absorption of supply rather than a trend reversal. The 20 EMA is gradually catching up with price, which is a healthy sign and suggests that buyers continue to defend lower levels. The current closing price around 4,864 is close to an important resistance zone near 4,900–5,000. A decisive breakout and sustained close above 5,000 could trigger the next leg of the uptrend, with potential upside targets towards 5,250–5,500 in the medium term. On the downside, immediate support is placed around 4,700–4,650, followed by stronger support near the rising 20 EMA around 4,550. As long as the stock holds above these levels, the overall structure remains constructive. Overall, the chart suggests a bullish bias with consolidation at higher levels. Traders may watch for a breakout above 5,000 for fresh momentum, while positional investors can maintain a positive outlook as long as the stock remains above the 4,550–4,650 support zone. Any dips towards support levels may attract buying interest within the prevailing uptrend. Disclaimer: This analysis is based solely on technical chart observations and should not be considered investment advice. Investors should use appropriate risk management and consult their financial advisor before taking any investment decisions.