Titan Company Ltd. – Technical Outlook
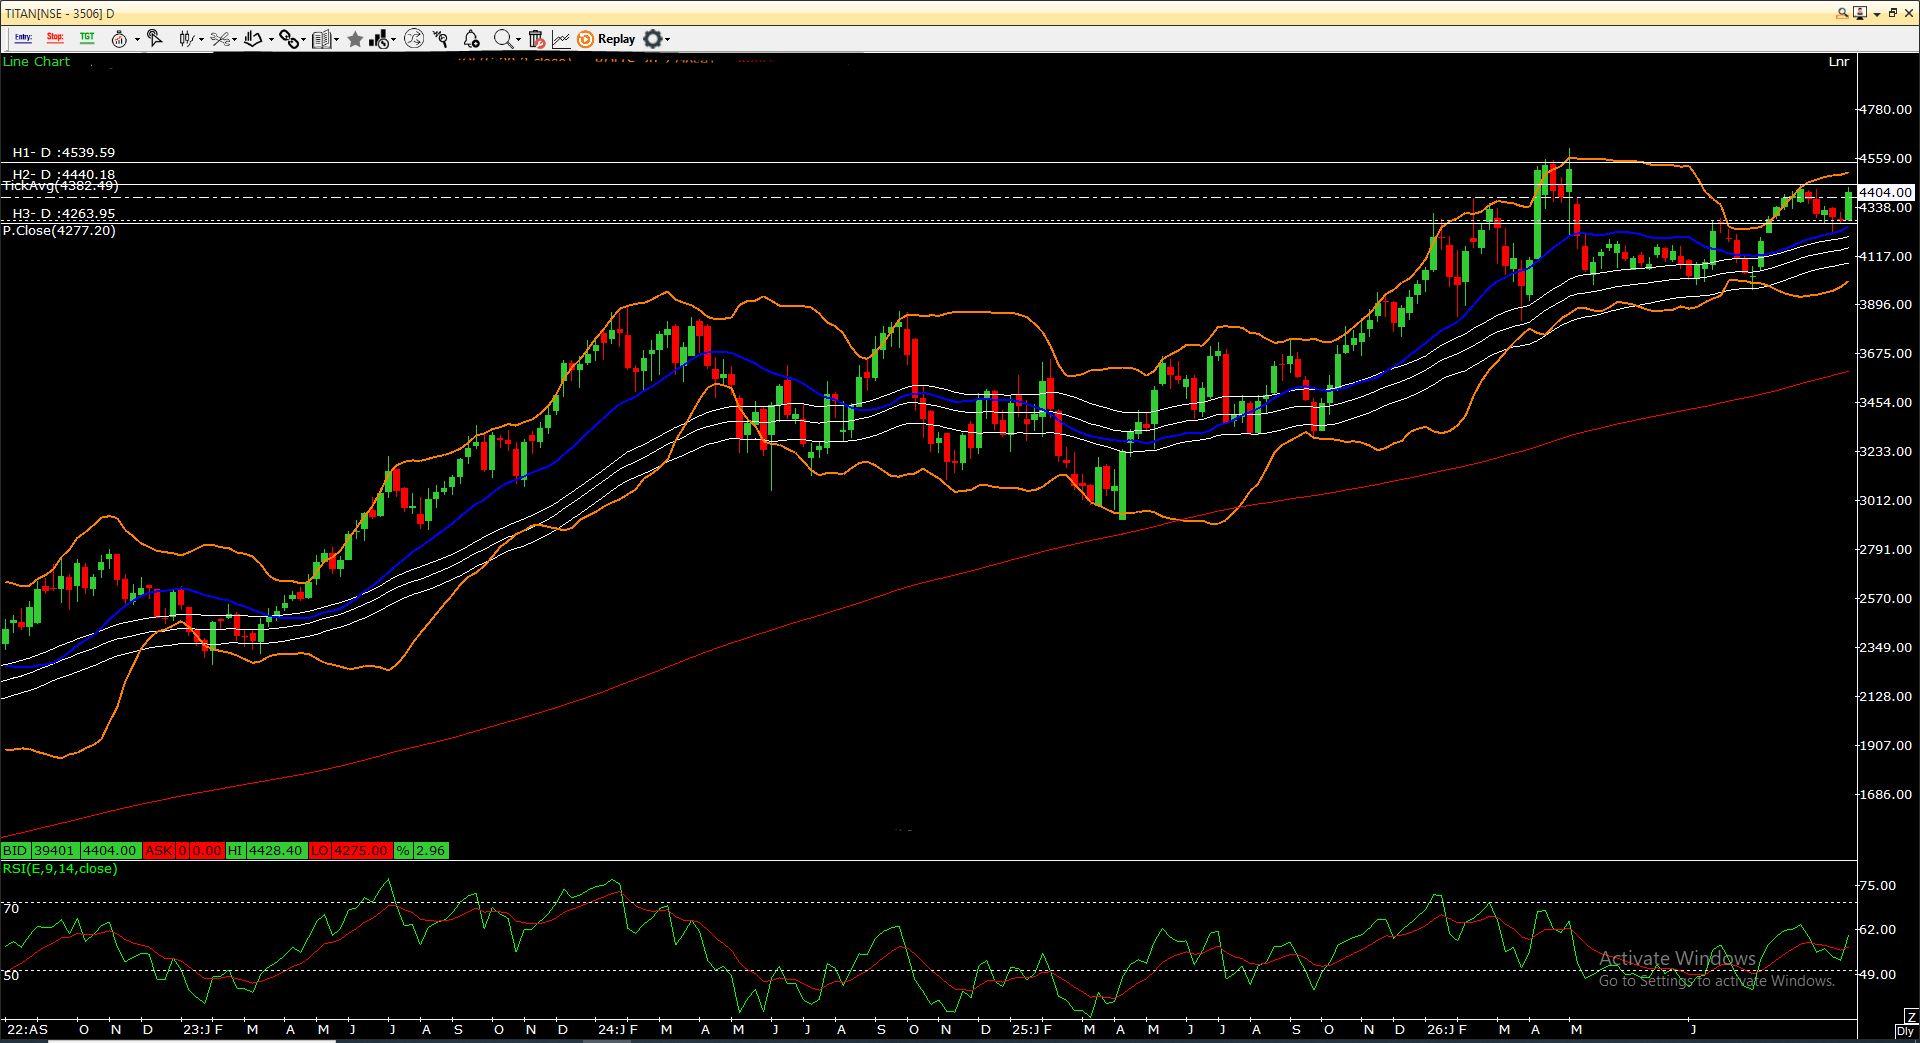
Titan continues to maintain a strong long-term bullish trend, trading comfortably above its 50-day and 200-day moving averages, indicating that the primary trend remains positive. After witnessing profit booking from the recent high near ₹4,560, the stock has found support around the ₹4,250–4,300 zone and is now showing signs of recovery with consecutive positive candles. The stock has reclaimed the short-term moving averages, while the 50-DMA is acting as immediate support, suggesting buyers are returning at lower levels. Bollinger Bands indicate that volatility has cooled after the recent correction, and the price is attempting to move back towards the upper band, which is generally a positive development. The RSI is hovering around 58-60 and has turned higher after remaining above the neutral 50 mark. This reflects improving momentum without entering the overbought zone, leaving room for further upside. On the upside, ₹4,410 is the first hurdle, followed by ₹4,540-4,560, which remains the major resistance zone. A decisive close above ₹4,560 could trigger fresh buying momentum and open the door for a move towards ₹4,700-4,800 in the medium term. On the downside, ₹4,260-4,280 is the immediate support, while ₹4,120 (50-DMA zone) is a stronger support. As long as the stock sustains above these levels, the broader bullish structure is expected to remain intact. Technical View: Bullish with Positive Bias Support: ₹4,280 | ₹4,120 Resistance: ₹4,410 | ₹4,560 Strategy: Traders may consider buying on dips with a positive bias while maintaining a stop loss below ₹4,120. Fresh momentum is likely to emerge on a sustained breakout above ₹4,560, which could lead to a new leg of the uptrend. $TITAN