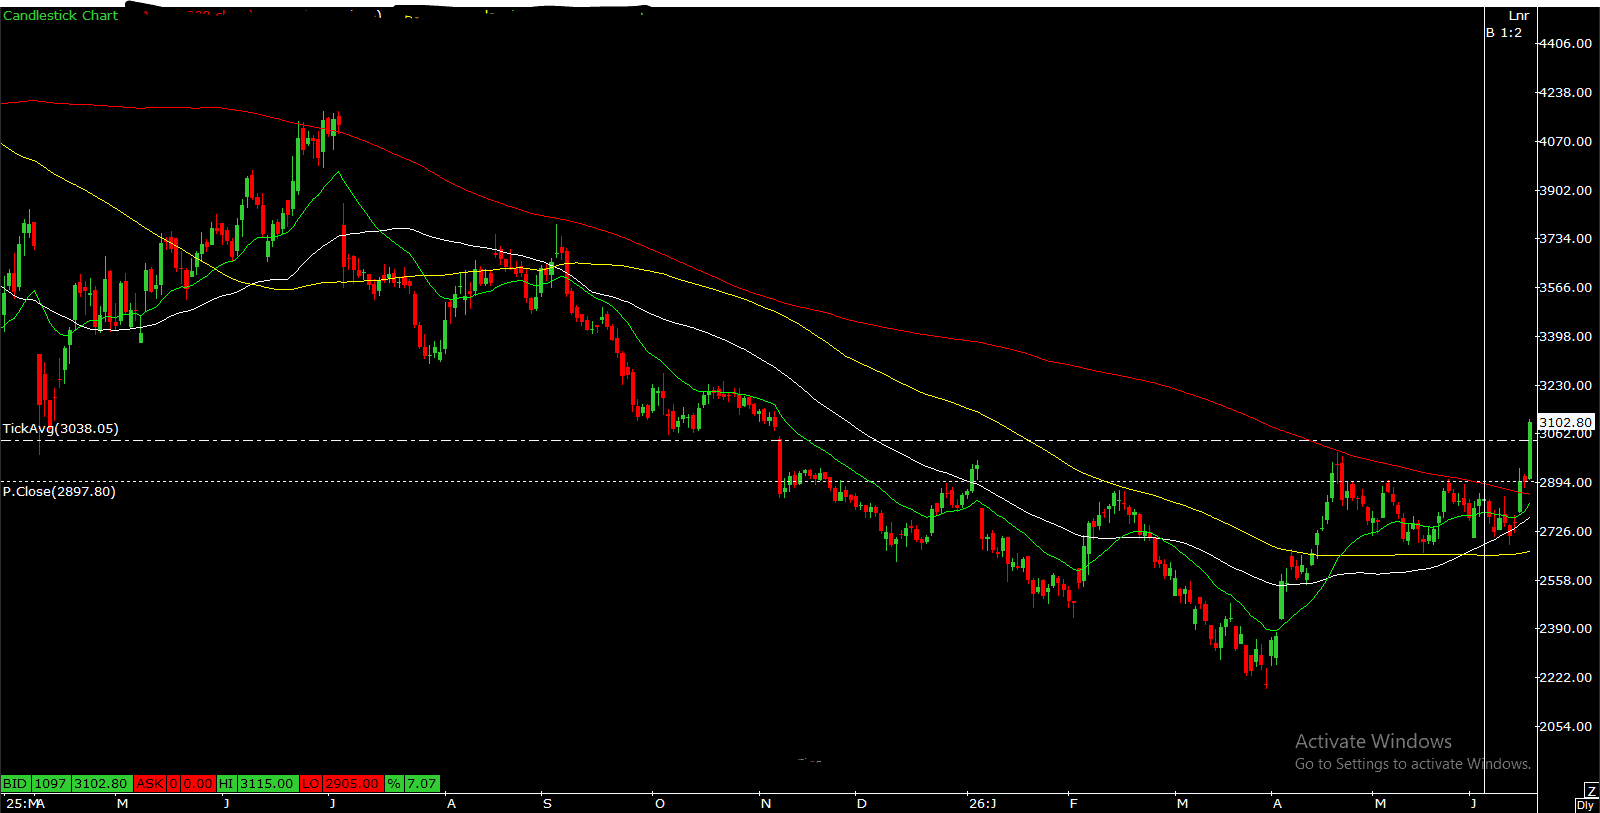
$TRENT - CHART ANALYSIS
After spending nearly a year under pressure, the stock is finally showing signs that the tide may be turning. The recent rally has not only lifted the price sharply from its lows but has also helped it reclaim all major moving averages, including the crucial 200-day moving average. Such a move often attracts the attention of long-term investors, as it signals improving market sentiment and a potential shift in trend. What makes the current setup particularly interesting is the manner in which the stock has emerged from its consolidation phase. For several months, the price remained trapped within a broad range, allowing weak hands to exit while stronger participants gradually accumulated positions. The breakout above the key 2,900 resistance zone suggests that this accumulation phase may now be translating into a fresh uptrend. The chart structure has also improved considerably. Higher lows have started to emerge, indicating that buyers are becoming increasingly willing to step in at elevated levels. At the same time, the stock has managed to sustain above important moving averages, strengthening the case for a medium-term recovery. Going forward, the 2,900–3,000 zone is likely to act as a crucial support area. As long as the stock remains above this region, the bullish narrative remains intact. While some consolidation after the recent sharp rally cannot be ruled out, such pauses would be considered healthy rather than a sign of weakness. Overall, the stock appears to be transitioning from a prolonged corrective phase into a recovery cycle. If buying momentum continues and the broader market remains supportive, the current breakout could mark the beginning of a larger upward move in the months ahead. $TRENT