TVS Motor: Trendline Breakout Signals Bullish Momentum
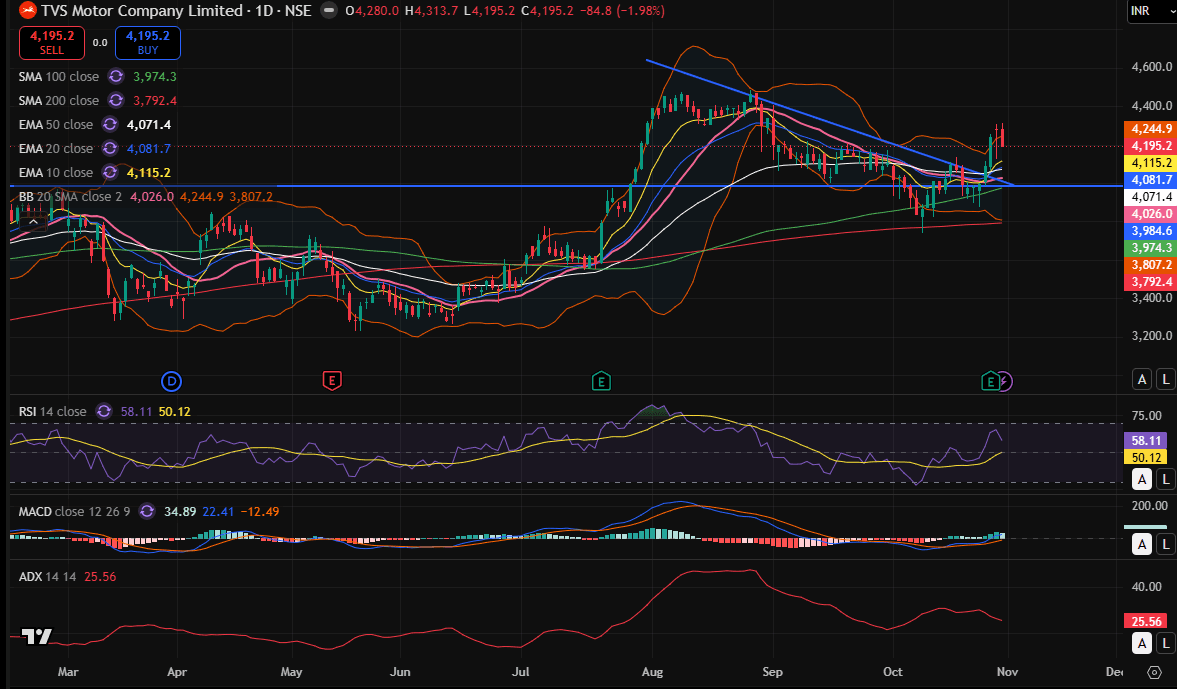
TVS Motor Company is showing signs of a potential trend reversal after decisively breaking above its downward-sloping trendline on the daily chart. The breakout, supported by a healthy rise in trading volumes, indicates improving buying interest and a possible continuation of the recovery.
The stock has also reclaimed its key short-term moving averages, with the price trading above the 10-day, 20-day and 50-day EMAs. This alignment reflects improving short-term price strength. The 200-day SMA near ₹3,792 continues to act as an important long-term trend reference.
Momentum indicators are also turning favourable. The RSI has recovered sharply from oversold territory, moving above the 50 mark (58.11 in the latest chart), indicating a shift towards positive momentum. The MACD is trading above its signal line with positive histogram bars, suggesting strengthening bullish momentum.
The ADX stands near 25.56, indicating improving trend strength. The DI+ crossover over DI-, as highlighted in the technical analysis, further supports the bullish outlook.
Key Levels to Watch
The ₹4,180–4,210 zone is an important accumulation area. Immediate resistance is placed around ₹4,245, while a sustained breakout could open the possibility of a move towards ₹4,470.
On the downside, ₹4,080 is an important support and stop-loss reference. A decisive close below this level could weaken the current bullish setup.
My View
TVS Motor's technical structure is improving, supported by a trendline breakout, recovering momentum and favourable moving-average positioning. However, traders should watch for sustained price action above the breakout zone rather than chasing sharp rallies.
Disclosure: The analyst or his family does not have any position in the stock.
Disclaimer: This article is for educational purposes only and should not be considered investment advice. Please consult your financial advisor before making investment decisions.