1 hour ago · SEBI Registration INH000019309
SEBI Registration INH000019309 · 1 hour ago
Union Bank Gains Momentum: Technical Setup Turns Bullish
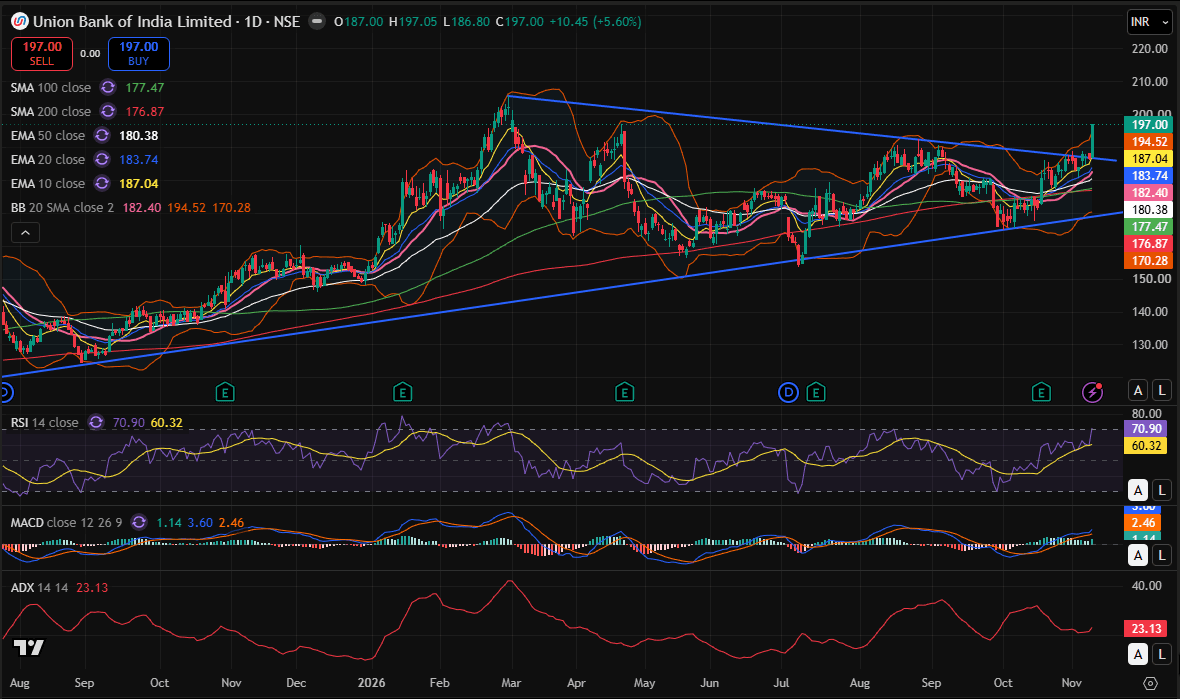
Union Bank of India witnessed a strong rally recently, closing at ₹197, as the stock delivered a decisive breakout above its long-term descending trendline resistance. The breakout from a symmetrical triangle pattern indicates improving bullish momentum and a potential shift in the short-term trend. Technical Analysis Trendline Breakout: The stock has moved above the upper boundary of its consolidation pattern, indicating strengthening buying interest. Moving Averages: Price is trading comfortably above the 10 EMA (₹187.04), 20 EMA (₹183.74), 50 EMA (₹180.38), 100 SMA (₹177.47) and 200 SMA (₹176.87). This alignment supports a positive trend structure. RSI: RSI stands at 70.90, indicating strong bullish momentum, although the stock is entering the overbought zone. MACD: MACD remains above its signal line with positive histogram bars, suggesting strengthening bullish momentum. ADX: At 23.13, ADX indicates that trend strength is gradually improving. Key Levels to Watch Immediate resistance: ₹200–205 Next resistance: ₹210 Immediate support: ₹192–190 Strong support: ₹187–183 My View Union Bank is showing encouraging technical strength following its trendline breakout. Sustaining above ₹194–195 could support further upside towards ₹200–205 and potentially ₹210. However, RSI near 71 indicates that some consolidation or profit booking cannot be ruled out. Traders should watch for price stability above the breakout zone before taking fresh positions. Disclosure: The analyst or his family does not have any position in the stock. Disclaimer: This article is for educational purposes only and should not be considered investment advice. Please consult your financial advisor before making any investment decisions. UNIONBANK