Adani Power: Technical Analysis and Outlook – 26th June 2025
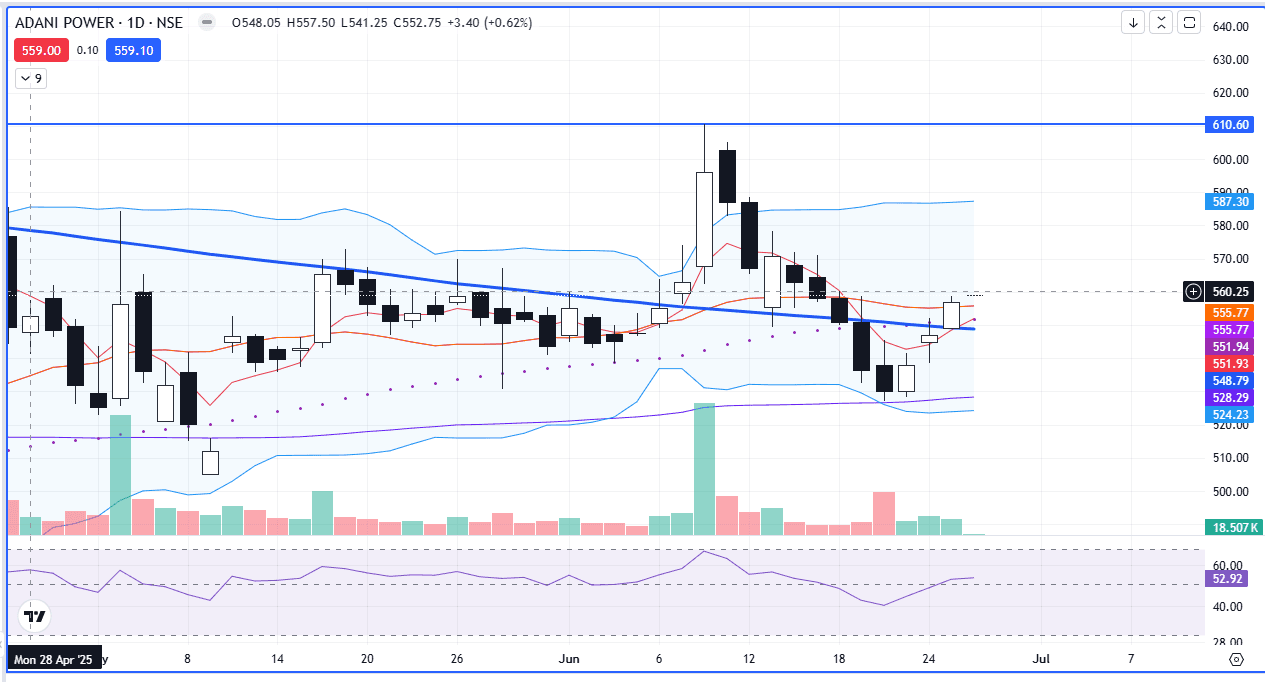
After a sustained downtrend, Adani Power showed signs of technical weakness by closing below its 200-day moving average (200-DMA) on 18th June 2025—a bearish development that indicated a potential continuation of the short-term negative trend. This weakness intensified on 19th June 2025, when the stock declined by 2.6%, reinforcing short-term selling pressure.
However, on 20th June 2025, the stock found strong support at the 100-day moving average (100-DMA). This level acted as a cushion for the price, leading to the initiation of a reversal trend. Following this bounce, the stock started regaining strength, signaling a shift in sentiment.
The most significant technical development occurred on June 25, 2025, when Adani Power closed above both the 200-day moving average (200-DMA) and the 20-day moving average (20-DMA). This dual breakout is a bullish confirmation, suggesting that the downtrend has likely concluded and that the stock is entering a recovery phase.
🔍 Key Technical Insights:
Trend Reversal Confirmation: Reclaiming the 200-DMA after a breakdown indicates strong buying interest and a shift from bearish to bullish sentiment.
Short-Term Momentum: The close above the 20-DMA shows that near-term momentum is strengthening.
Potential Moving Average Crossover: A bullish crossover between the 5-day and 20-day moving averages is developing. Such a crossover typically acts as a leading indicator of a potential uptrend and may attract short-term momentum traders.
Volume Support: If this upward movement is accompanied by increasing volumes, it would further validate the breakout and add confidence to the bullish outlook.
🎯 Price Projections and Key Levels:
Immediate Support: ₹540 – ₹545 (aligned with the 100-DMA and recent bounce)
₹580 (short-term target)