


AMBUJACEM Showing Signs of Weakness After Overbought Signals
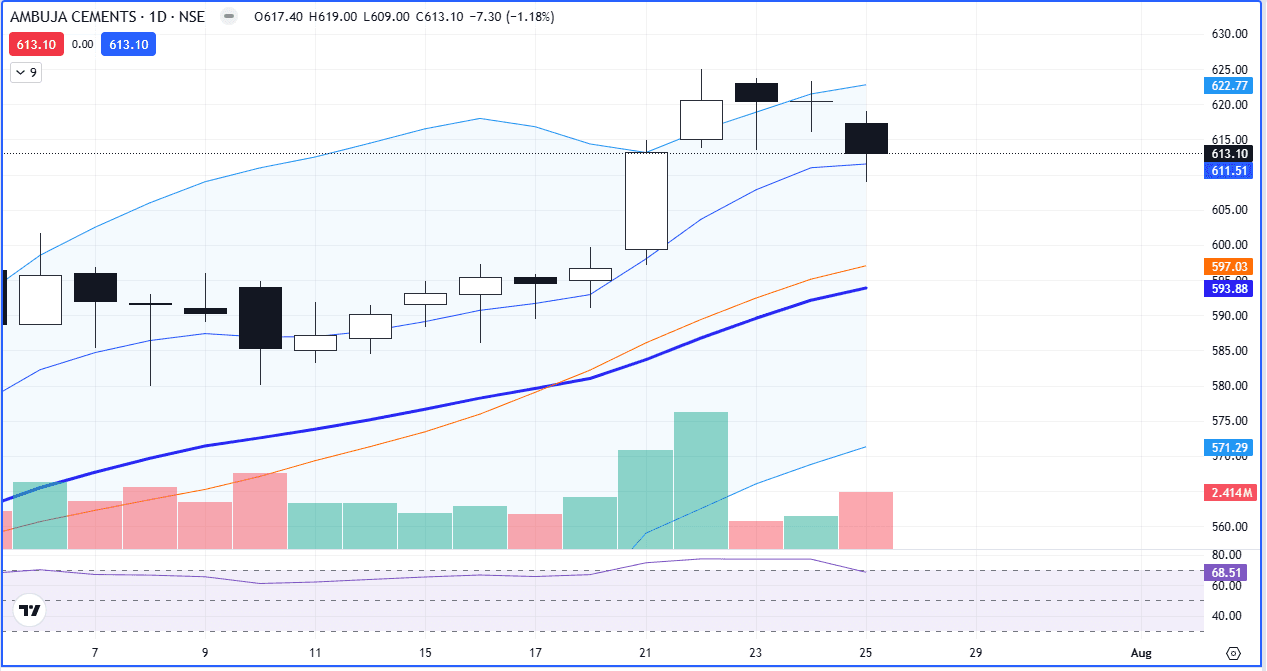
On 22nd July 2025, the stock of AMBUJACEM formed a candle above the upper Bollinger Band, and the RSI was at 77, which shows the stock was in the overbought zone. Again, on 23rd July, the candle was outside the upper Bollinger Band and the RSI increased to 79, which is a strong sign that the stock was overbought and may not continue rising for long.
On 24th July, a Doji candle was formed, which usually means that buyers and sellers are unsure about the next move. On the same day, the stock fell by 1.18%, which may be the start of a downward move.
Looking at these signals, the stock price might fall further in the coming days. It could move down to its 20-day moving average, which is currently around ₹527.
#TechnicalViews#EquityResearch
671 likes·74 comments