


ASHOKLEY stock analysis and chart patterns with important levels
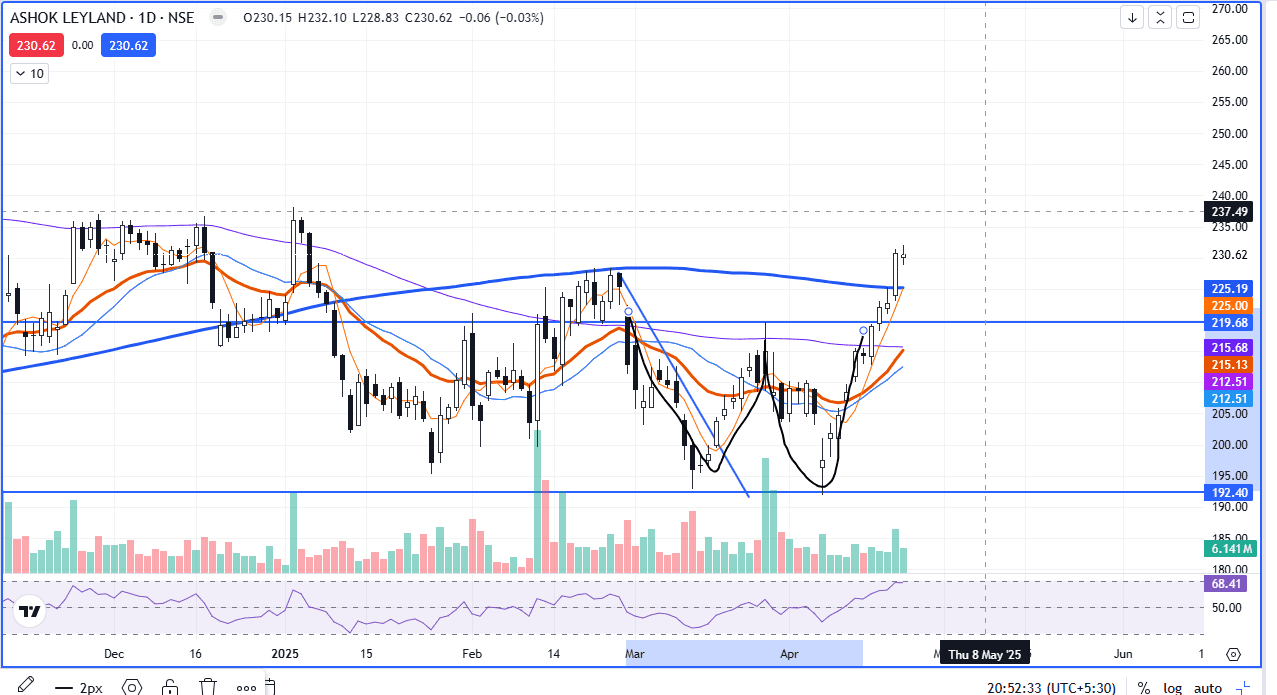
ASHOKLEY stock price closes above the 200 moving average
A 200 moving average acts as an important support and resistance level
also, there is a crossover between the 20 and 100 moving averages in the upward direction, which indicates the rise in price
RSI is currently trading at 68.41
RSI 0 TO 30 oversold zone and 70 to 100 overbought zone
till the stock price is about 200 moving average, we are BULLISH
The 200 moving average will act as an important support level
Also double bottom chart pattern is also seen
forming important support and resistance levels of 219 and 193, respectively, and the stock price has also given its breakdown
#TechnicalViews#WatchOutFor#TrendingSectors
223 likes·23 comments