‹ All Posts
RA Anupam Bajpai

4th Aug 2025 · SEBI-Registered Analyst

ASIANPAINT
ints: Bullish Breakout Signals Further Upside Potential

After a sustained downtrend, the stock price of
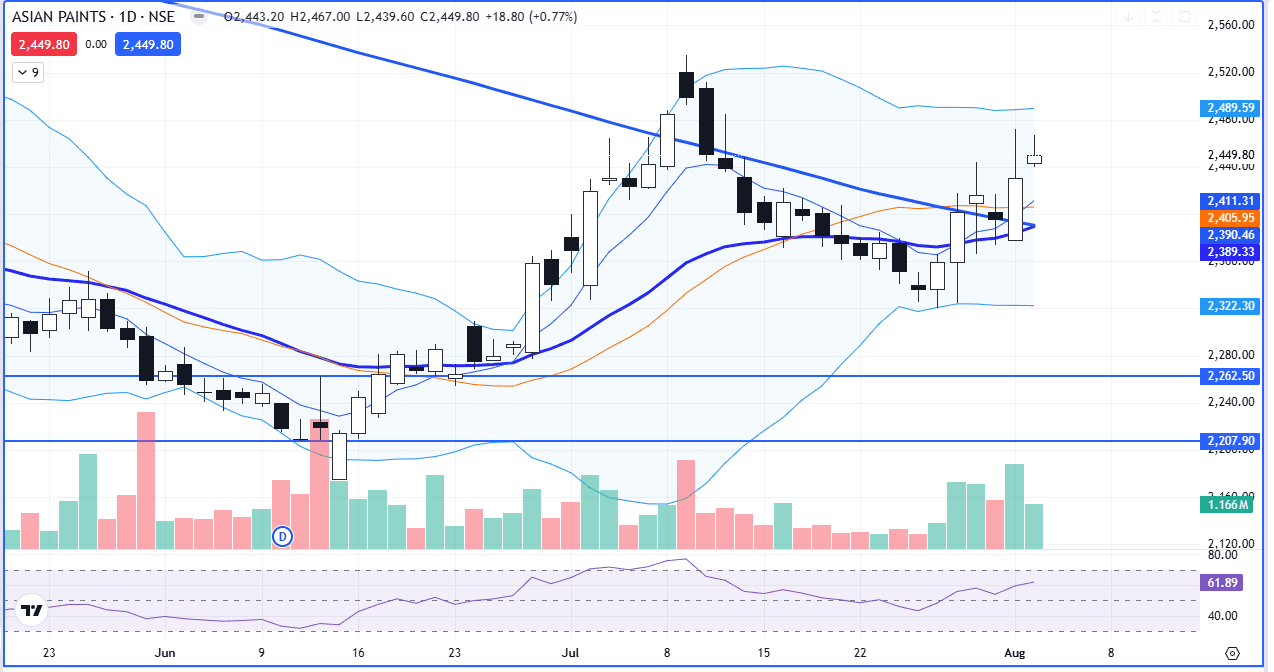
ASIANPAINT
ints has shown a strong reversal by forming a rounding bottom chart pattern, a classic bullish formation that indicates accumulation and trend reversal. The base of this pattern found solid support around ₹2,320, while the neckline (resistance) was at ₹2,400. On 1st August 2025, the stock decisively closed above the key resistance level of ₹2,400, confirming the breakout. Notably, the stock also closed above its 200-day moving average, a critical long-term indicator that now shifts from resistance to a strong support level. This reinforces the bullish sentiment. Adding to the strength of the breakout, there was a bullish crossover between the 5-day and 20-day moving averages, further validating upward momentum. Given these technical signals, the stock is poised for further upside, and a potential move towards ₹2,520 could be expected in the near term, provided it sustains above the breakout level.

#TechnicalViews
Screenshot 2025-08-04 155759.png
830 likes·16 comments