


BEL stock price analysis and chart pattern
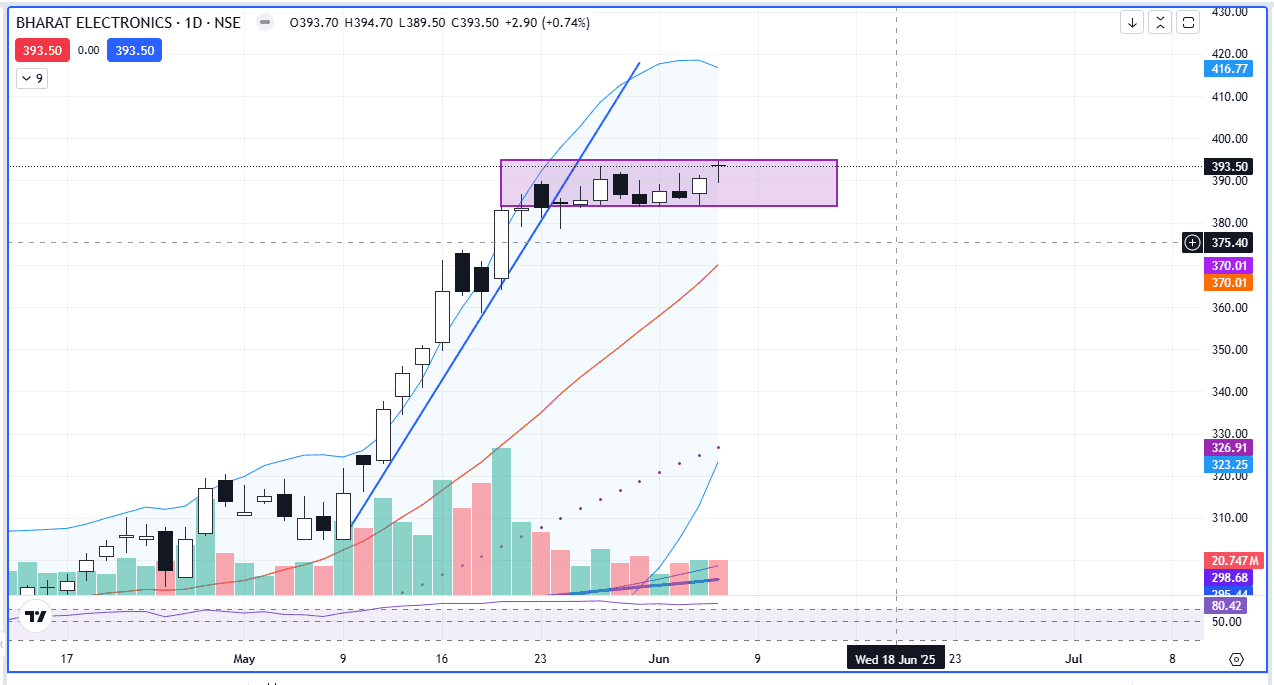
After a sharp uptrend, the stock price of BEL lectronics started consolidating between the range of 394 and 383
And formed a proper sideways pattern
The levels of 394 and 383 will act as important support and resistance level, respectively
The investor should wait for the breakout
If the stock price closes above the level of 394 we will be bullish on it
And if the stock price closes below the support level of 383, we will be bearish on it
RSI is at 82.42, which indicates that the stock price is trading in the overbought zone
Important support level 374, important resistance level 405
#TechnicalViews#EquityResearch#WatchOutFor
223 likes·63 comments