


CIPLA BEARISH VIEW CHART PATTERNS AND MOVING AVERAGES
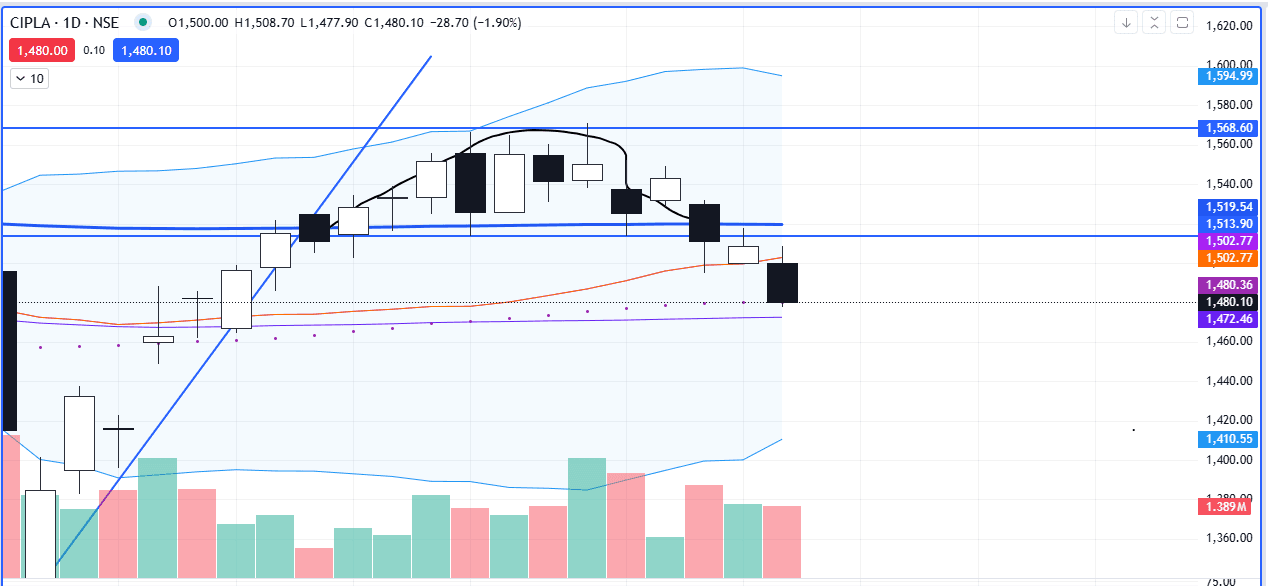
After a sharp uptrend the stock price of CIPLA started consolidating and formed support and resistance level of 1510 and 1570 respective
The stock price has formed rounding top candle stick chart pattern on daily basis chart
and on 6th may 2025 it has given its breakout and closes below the support level of 1510 indicating further fall
and also closes below 200 moving average
200 moving average acts as important support and resistance now the further fall may be seen in the stock price of CIPLA
1510 will act as important resistance level now
as support and resistance levels are interchangeable once broken
#TechnicalViews#WatchOutFor#EquityResearch
275 likes·79 comments