


GRASIM stock analysis and important break out
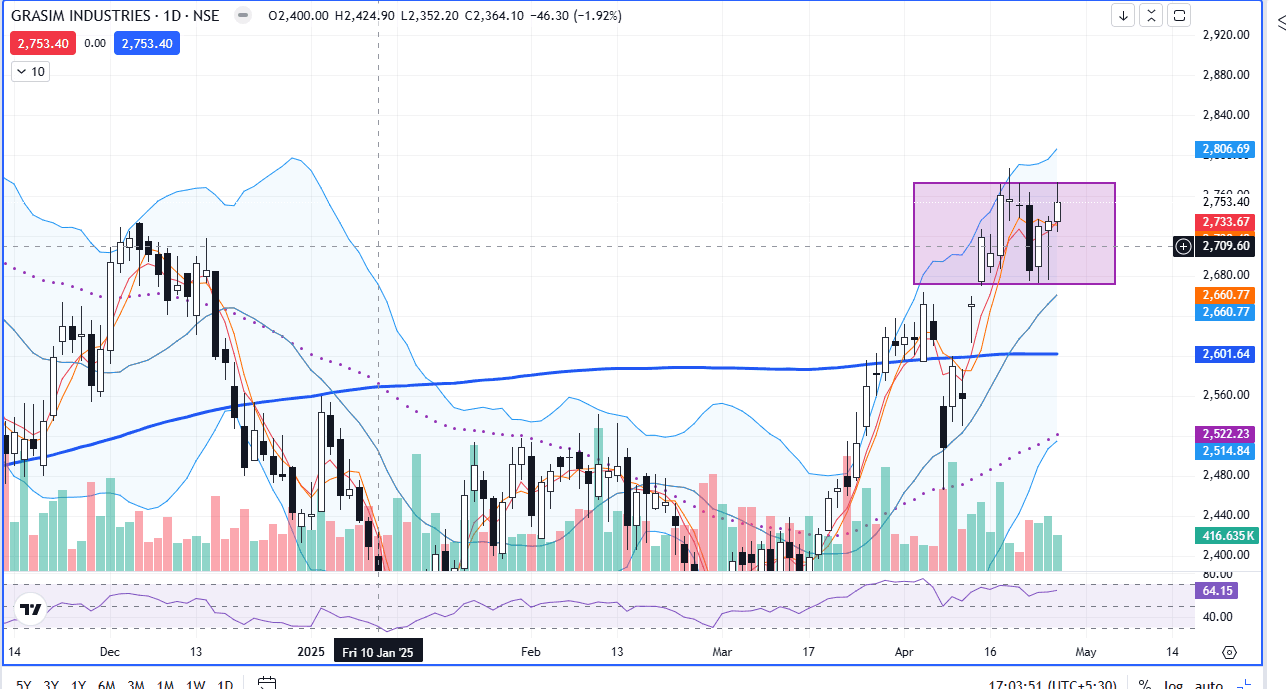
On 7th April 2025, GRASIM stock price has taken support from the 50 exponential moving average
and formed an uptrend, closing above the 200 moving average
On 11th April 2025 Doji Candlestick was formed on the daily chart
A doji is a single candlestick pattern in which the open and close prices of the security or market are the same or very close to it.
and from 15th April 2025, the stock price started consolidating and formed very important support and resistance levels all 2670 and 2775, respectively.
Currently, the stock is trading at 2753.4
The view on the stock is positive
The investor should wait for the breakout of the resistance level, which is 2775
RSI is 64
#TechnicalViews#EquityResearch#WatchOutFor
215 likes·60 comments