‹ All Posts
RA Anupam Bajpai

17th Jul 2025 · SEBI-Registered Analyst

HINDZINC
Technical Outlook: Signs of a Bullish Reversal Emerging

After a prolonged phase of limited movement, the stock price of
HINDZINC
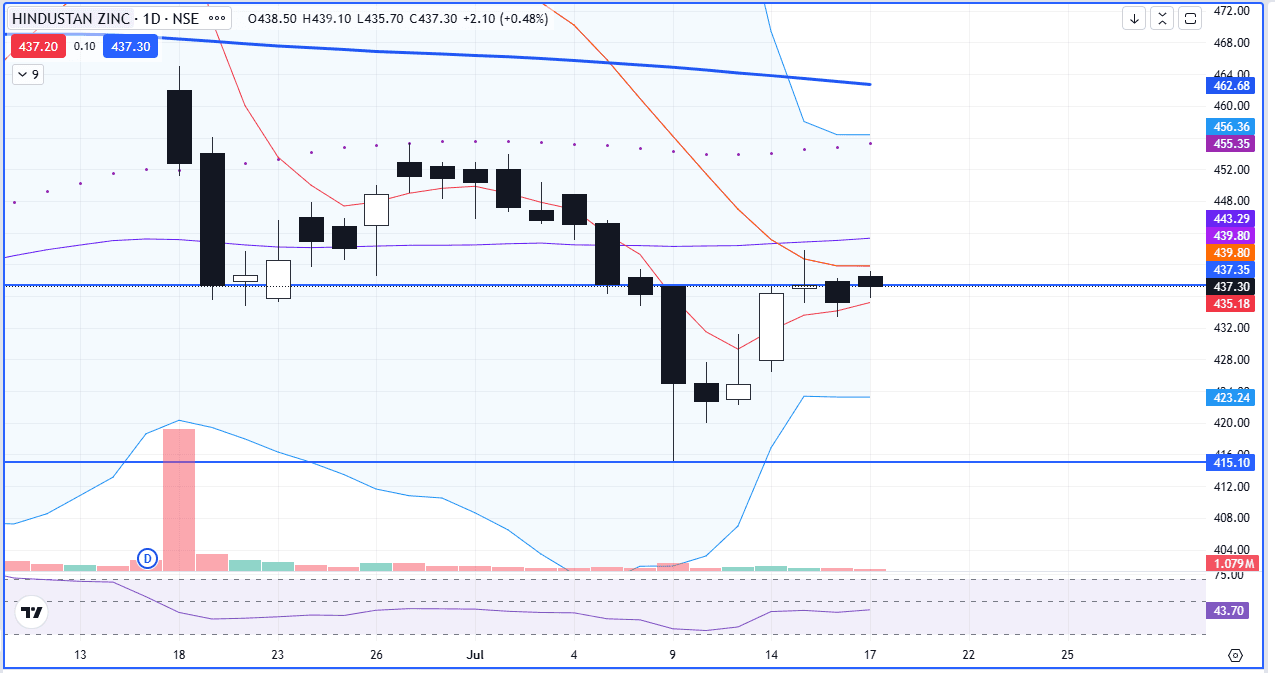
has entered a consolidation phase, trading within a well-defined range. During this period, the stock has established a strong support level at ₹415 and a key resistance level at ₹437. These levels will be crucial in determining the stock's next directional move. A rounding bottom chart pattern has started forming, which is a classic bullish reversal pattern. This formation indicates a gradual shift in investor sentiment from bearish to bullish, often leading to a breakout on the upside once the pattern completes. Moreover, a potential bullish crossover between the 5-day and 20-day moving averages may occur soon. This crossover—where the short-term average crosses above the longer-term average—is considered a positive technical signal, suggesting the beginning of an upward trend. The Relative Strength Index (RSI) currently stands at 43, which indicates that the stock is in a neutral zone. RSI is a momentum oscillator ranging from 0 to 100 and helps assess whether a stock is overbought (above 70) or oversold (below 30). An RSI of 43 suggests there is still room for upward movement without being overextended. As long as the stock continues to trade above the breakout level of ₹437, the outlook remains bullish. In such a scenario, the stock may aim for the next resistance near the 50-day moving average, which is currently placed around ₹455.

#TechnicalViews#EquityResearch
Screenshot 2025-07-17 122101.png
1,061 likes·9 comments