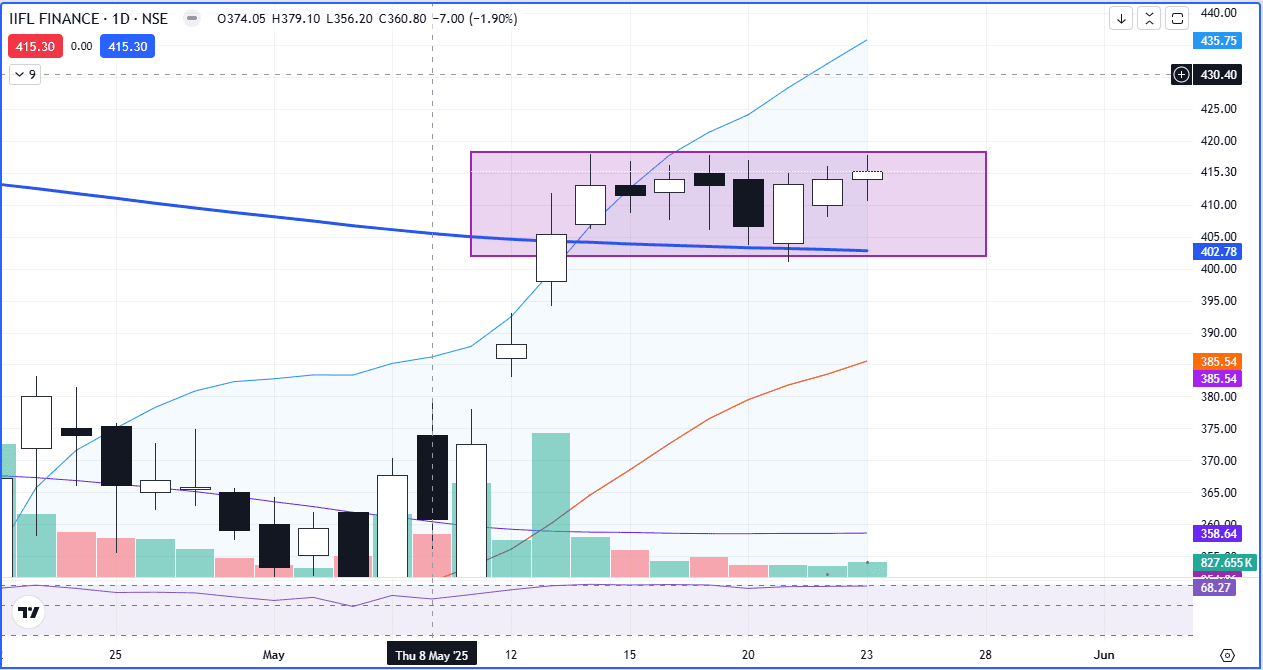
A proper sideways chart pattern has been seen on the chart of
IIFL
On 13th May 2025 crossover has been seen between 20 and 100 moving averages in the upward direction, which indicates a further rise in stock prices and
Also, on 13th May 2025, the stock price gave its closing about 200 moving average and
From then on, the stock price is trading above the 200 moving average
On 20th and 21st May 2025, the stock price has taken support from 200 moving average and closed above it
After the consolidation phase of approximately one week
Now, the further rise in stock price may be seen
will be bullish until the stock price is stating about the the 200 moving average
A 200-day moving average will act as an important support level
The important resistance level is 418
RSI is currently at 68