


INDIGOPNTS stock price analysis and chart pattern
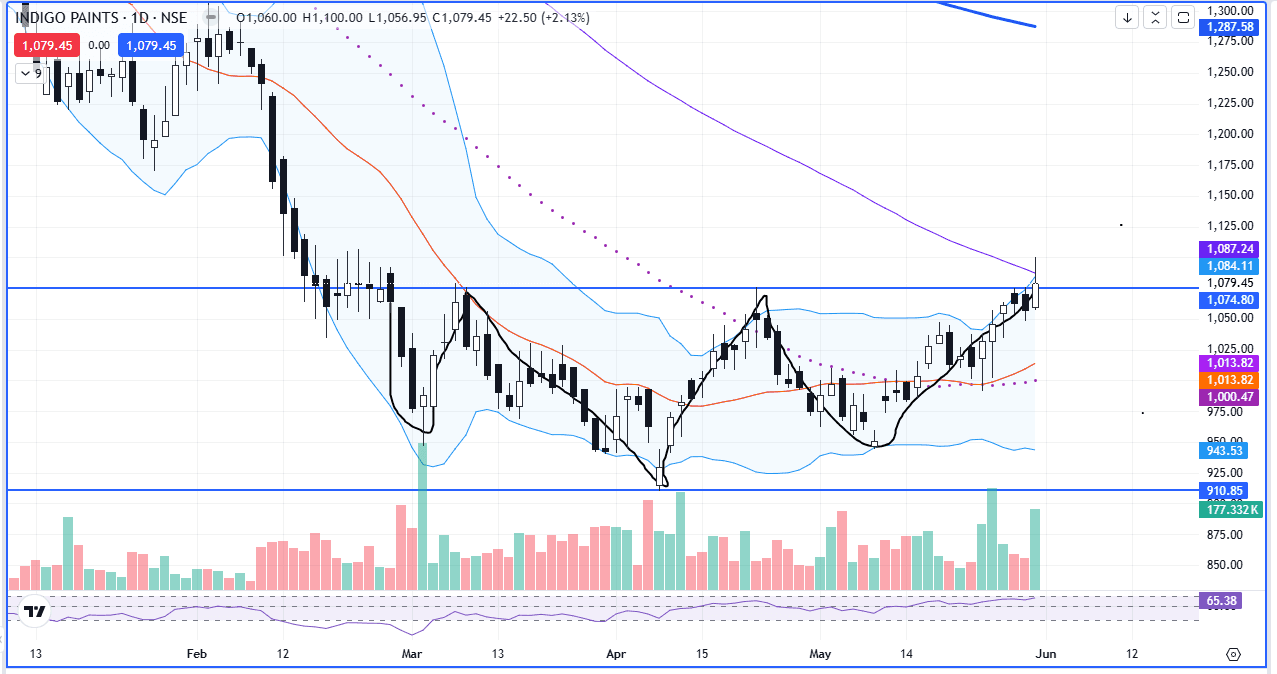
After a sharp downtrend, the stock price of INDIGOPNTS started consolidating
and formed an inverted head and shoulder chart pattern with important support and resistance levels of 910 and 1075, respectively
An inverted head and shoulders chart is a reversal chart pattern that indicates a potential shift from a downward trend to an upward trend. The pattern consists of three successive lows, with the middle low being the lowest and the two outer lows being higher
And today, approximately one month later
The stock price of INDIGOPNTS has crossed the important resistance level of 1075
Now, the further rise in stock price may be seen, and the stock price may move towards the level of 1150
S is at 65
#WatchOutFor#TechnicalViews#EquityResearch
210 likes·77 comments