‹ All Posts
RA Anupam Bajpai

15th May 2025 · SEBI-Registered Analyst

IRFC
stock price analysis, chart pattern, and various indicators

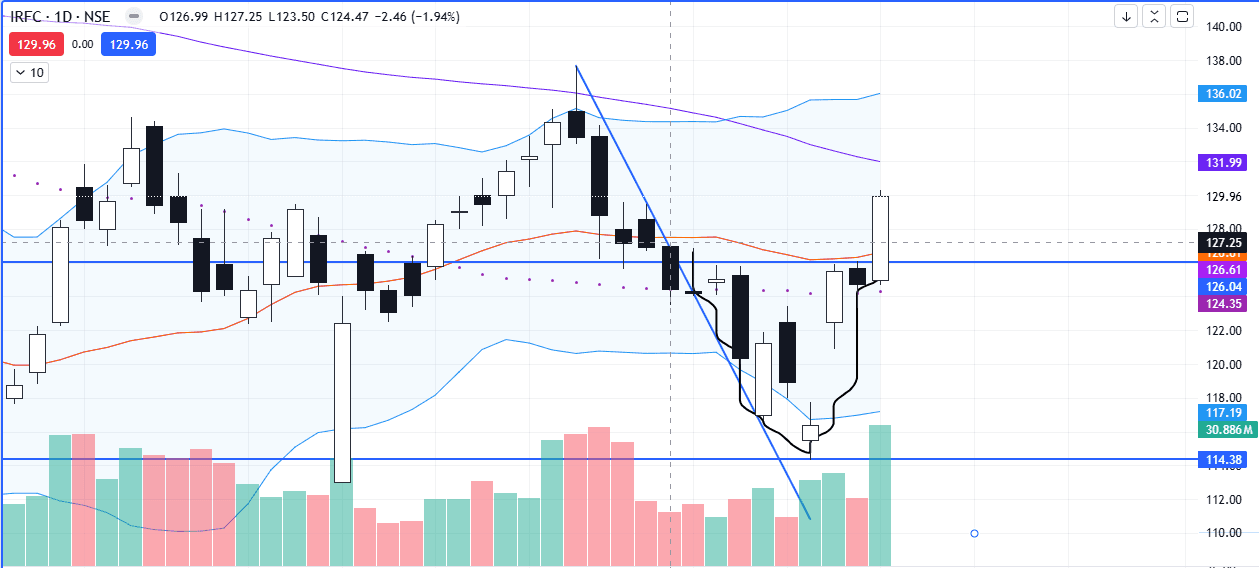
After a downtrend, the candlestick of the stock
IRFC
is seen below the lower band of the Bollinger band, Bollinger band consists of a 20 Moving average with proper upper and lower bands Bottoms and top made outside the band, followed by top and bottom band inside the band, suggest a reversal of the band and a rapid increase or rise in the stock price of
IRFC
has been seen And yesterday, the stock price of
IRFC
closed above an important resistance level of 126 The chart of Irf C stock also shows a rounding bottom chart pattern, and the breakout occurred yesterday at the resistance level of 126, indicating a further rise in stock price A further rise in stock price may be seen, and it may move towards the 136 level Also, the stock price has given its closing about 20 moving average and 50 exponential moving average Level 126 will act as an important support level now

#WatchOutFor#TechnicalViews#EquityResearch
Screenshot 2025-05-15 084726.png
269 likes·45 comments