


ITC stock analysis and chart patterns
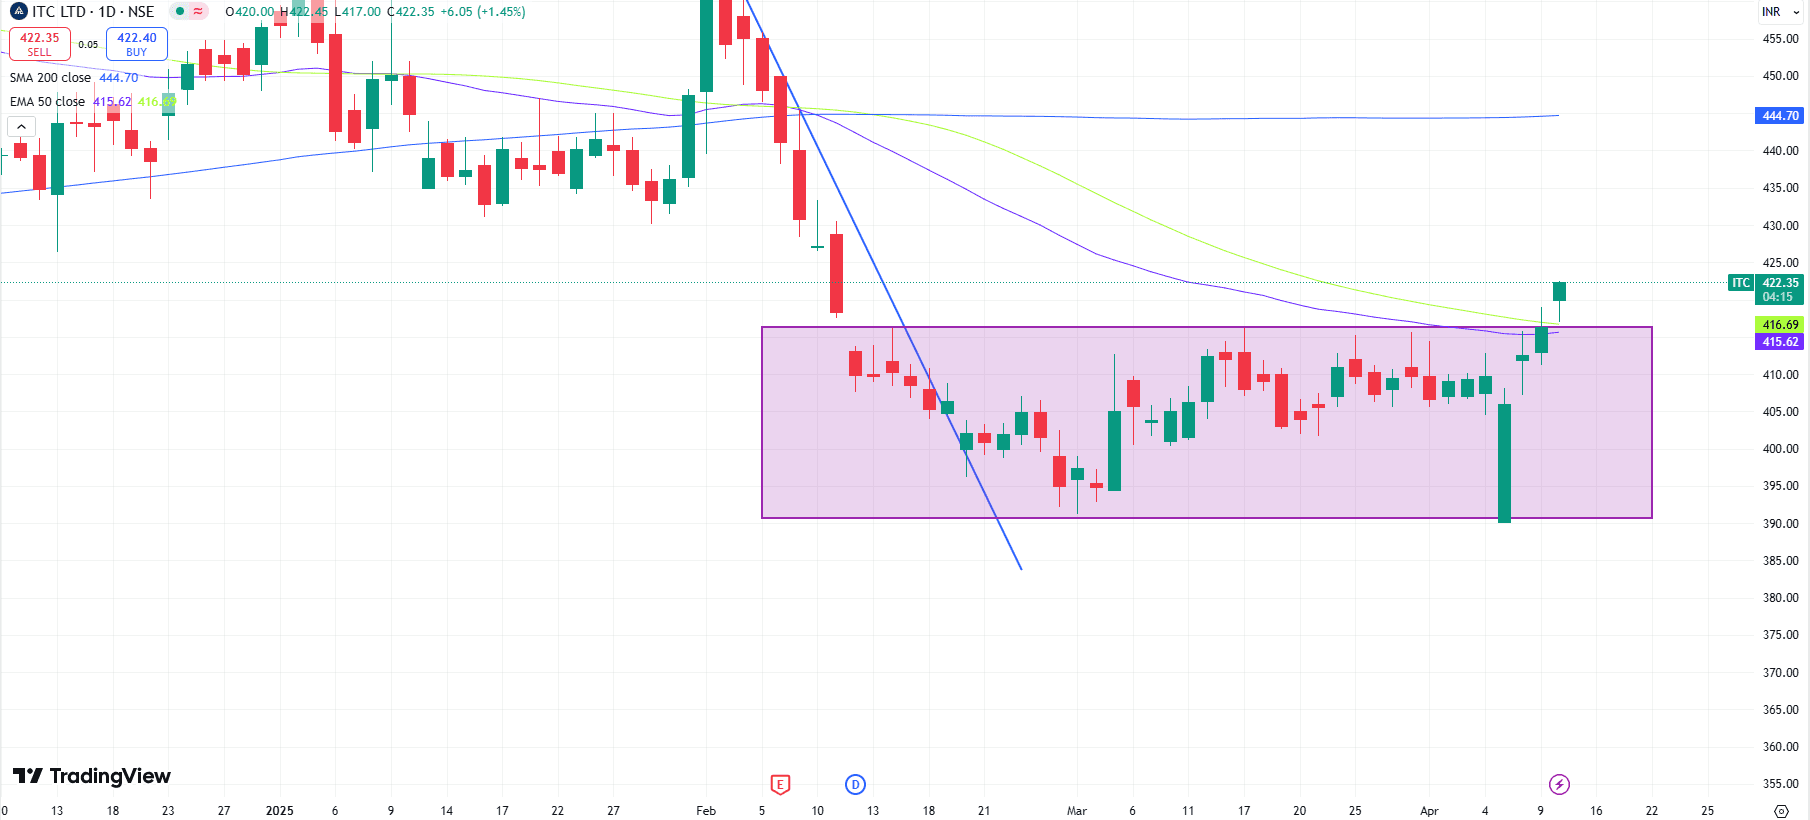
After a sharp downtrend, the share prices of ITC started consolidating and forming a sideways pattern with important resistance level of 416 and support level of 380
Yesterday, the share price of ITC gave a breakout to the resistance level of 415
Signal bullish towards 450
50 EMA will act as an important resistance
The share price was trading between the range of 416 and 390
Technical suggests bullish continuation
In a sideways chart pattern, the stock price use to moves in a range, forming support and Resistance levels
#TechnicalViews#EquityResearch
166 likes·70 comments