


KIMS stock price analysis chart pattern formed
KIMS
After forming a downtrend
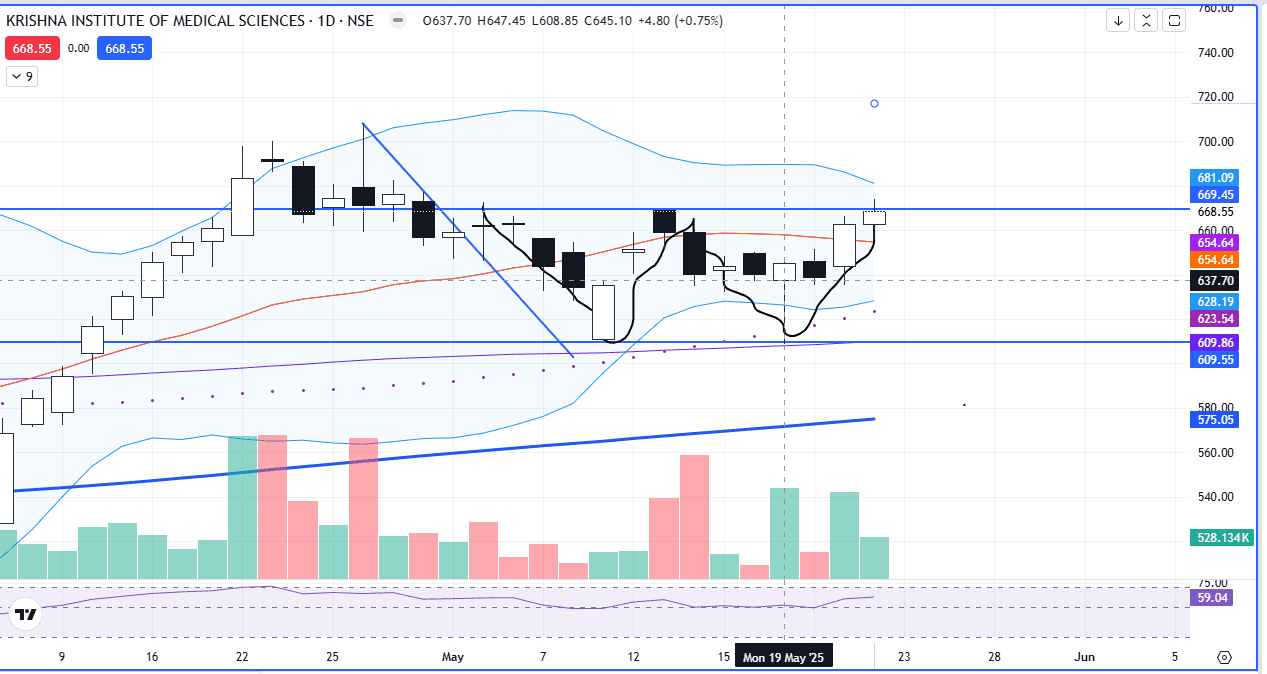
The stock price of KIMS started consolidating and formed a sideways chart pattern with important support and resistance levels of 609 and 670, respectively
Also, the stock price of Krishna has formed a double bottom chart pattern
And once the stock price closes above the resistance level of 670, we will be bullish.
and the stock price may move toward the level of 720
Yesterday, the stock price closed about 20 moving averages
RSI 59
Important resistance levels 708
#TechnicalViews#WatchOutFor#EquityResearch
255 likes·74 comments