‹ All Posts
RA Anupam Bajpai

12th May 2025 · SEBI-Registered Analyst

NTPC
STOCK PRICE ANALYSIS BOLLINGER BAND CANDLESTICK AND IMPORTANT LEVELS TO WATCH OUT

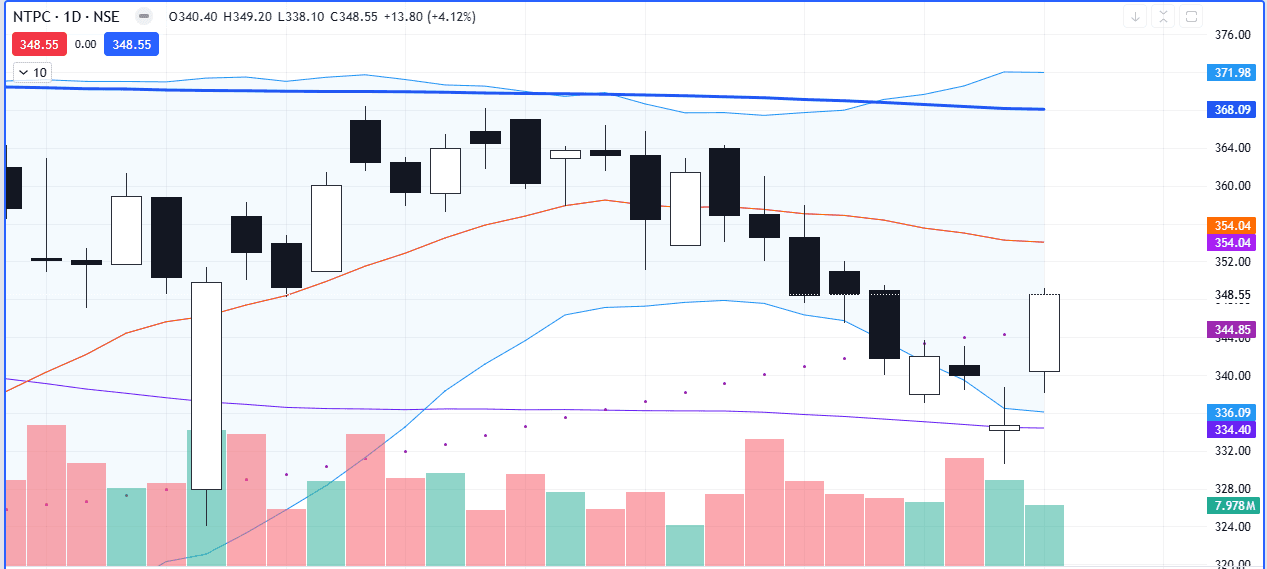
After a downtrend act like a DOJI candlestick was seen on the chart of
NTPC
on 9th May 2025 whose upper and lower shadows were approximately equal on daily basis chart It indicates that the bulls and bears are equally responsible for the formation of such a kind of candlestick Also, this candlestick was formed outside the lower band of the Bollinger Band, which indicates a rise in price Bollinger band consists of a 20-day Moving average with proper upper and lower bands Bottoms and top made outside the band, followed by top and bottom band inside the band, suggest a reversal of the band Today's stock price of
NTPC
surged 4.12% and closed above the high of yesterday's candlestick Also, it closes above the 50 exponential moving average The further rise in stock price may be expected A 20 moving average may act as a resistance level

#WatchOutFor#TechnicalViews#EquityResearch
Screenshot 2025-05-12 174115.png
276 likes·88 comments