


ONGC stock price analysis and important levels
ONGC
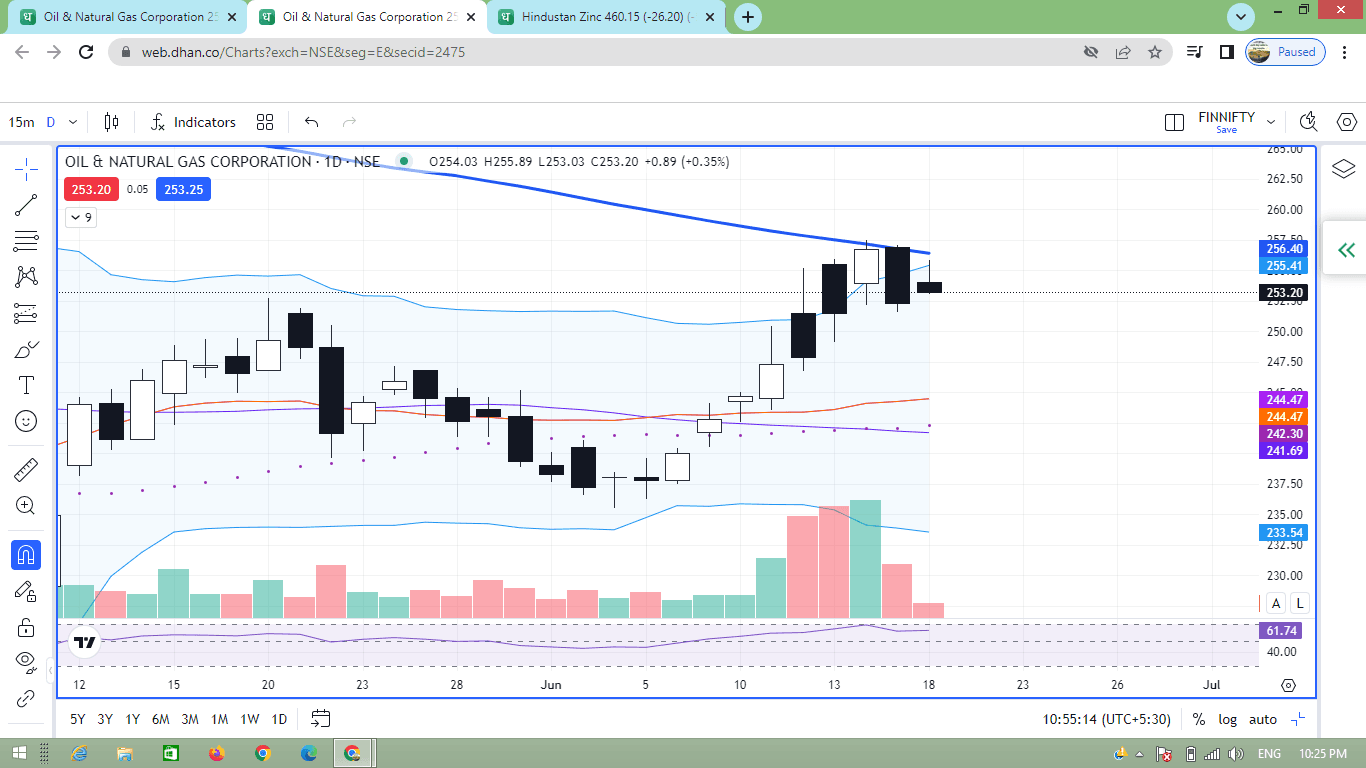
on 4th june a DOJI candlestick pattern was seen on daily basis chart
after that a uptrend was seen
on 6th june 2025 a crossover was also seen between 20 and 100 moving average in upward direction which indicates further rise in stock price
the stock price started consolidating from 12th june
and on 16th and 17th june 2025 it faced resistance from 200 moving average
now the further fall in stock price may be seen
and ut may move towards 20 moving average
200 moving average is acting as an important resistance level
bullish until the stock price is trading below it
#WatchOutFor#TechnicalViews#EquityResearch
125 likes·65 comments