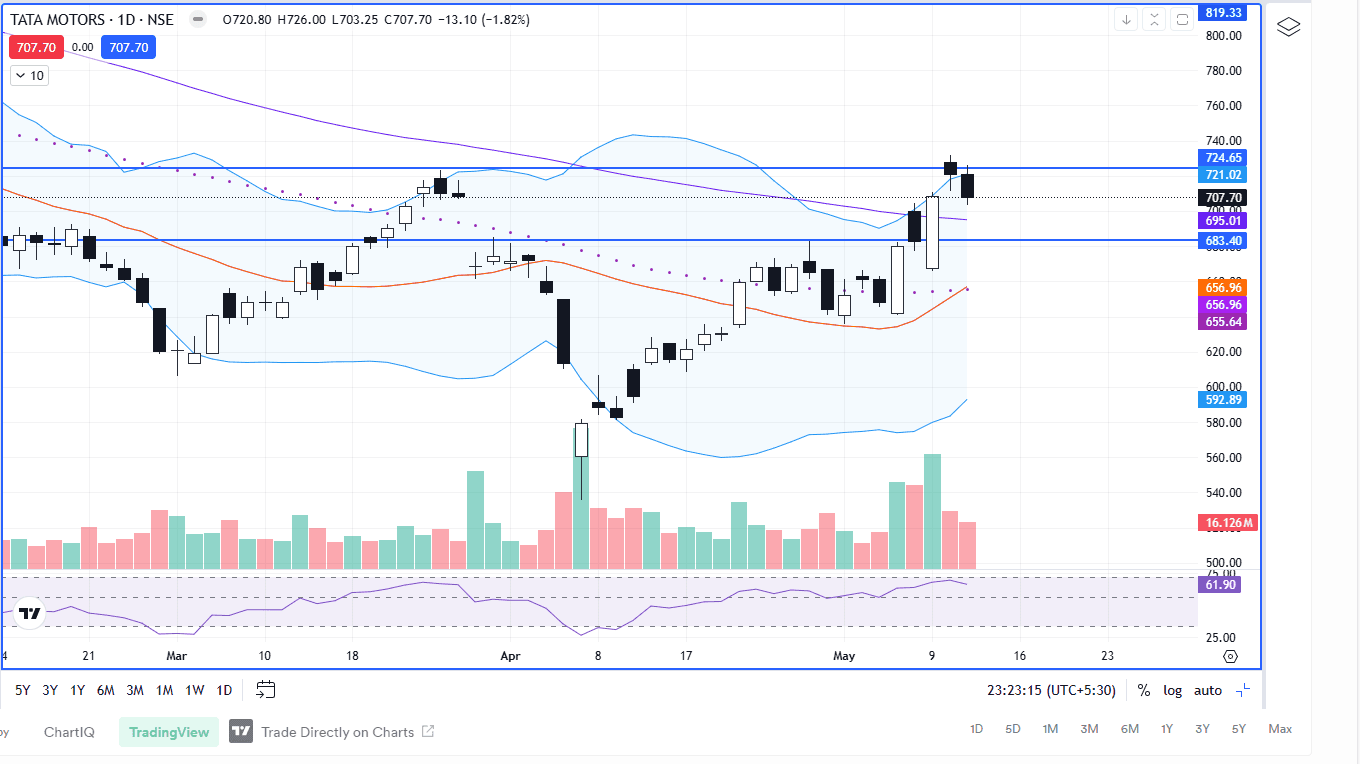
On 7th April 2025, the candlestick was formed outside the lower band of the Bollinger Band, which indicates price rise, and also at the time the RSI was at 25, which also indicates an increase in prices.
Bollinger band consists of a 20-day Moving average with proper upper and lower bands.
Bottoms and tops made outside the band, followed by the top and bottom band inside the band, suggest a reversal of the band.
After that, an uptrend has been seen on the chart of
TATAMOTORS
After forming the uptrend, the stock price started consolidating between the levels of 635 and 683
On 9th May, it gave its closing above the resistance level of 683
But yesterday it closed below the important support level of 725
And today, the stock price of Tata Motors has fallen 1.82%
A further fall in the stock price may be seen
The price may move towards the important support level of 683
A 50 exponential moving average may act as an important support level that is currently at 656