‹ All Posts
RA Anupam Bajpai

16th Jul 2025 · SEBI-Registered Analyst

TCS
Stock Analysis: Signs of Reversal Emerging After Oversold Conditions

After a strong downtrend, the stock price of
TCS
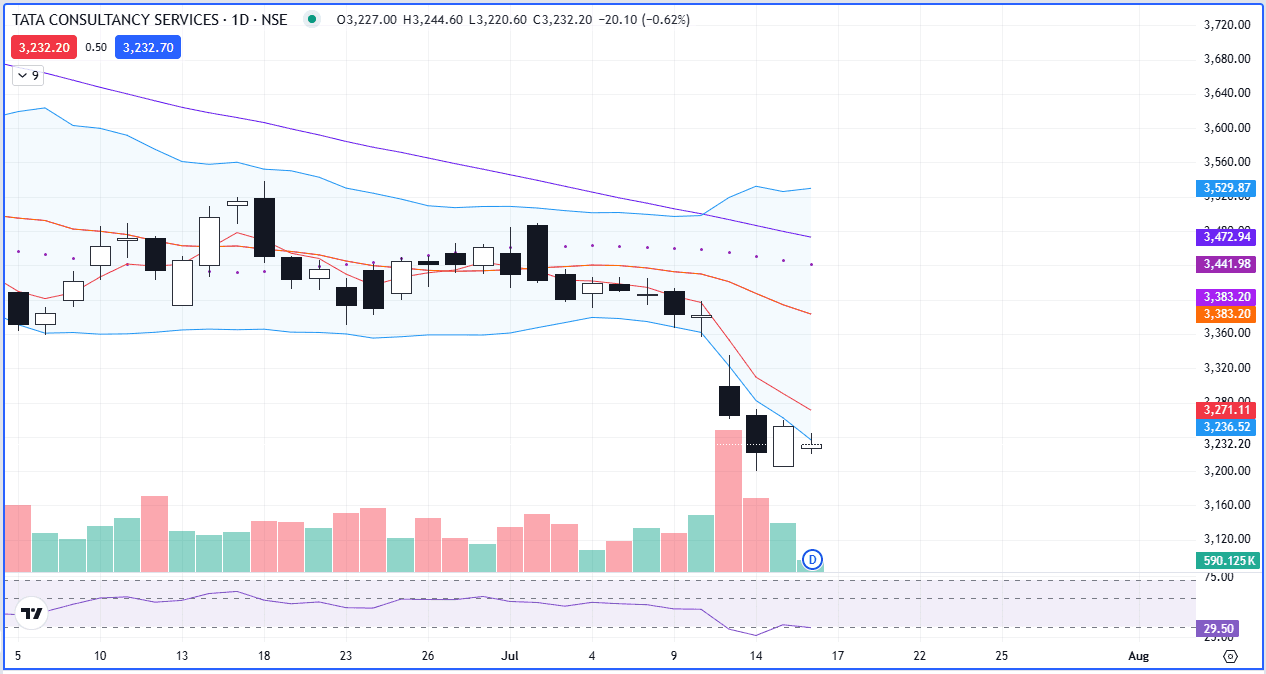
began consolidating within a range of ₹3360 to ₹3490, where ₹3360 acted as a key support level and ₹3490 as resistance. On 11th July 2025, the stock gave a closing below the important support of ₹3360 and formed a bearish candlestick that was completely outside the lower band of the Bollinger Band. This indicated that the stock had entered an oversold zone, suggesting selling pressure was high. On the next trading day, 14th July, another bearish candlestick was formed outside the lower Bollinger Band, reinforcing the bearish sentiment. However, on 15th July, a bullish candlestick was seen, but it too was outside the lower band, which means the stock was still in the oversold territory, though showing early signs of recovery. The Relative Strength Index (RSI), which was at 25 on 14th July, has now risen to 31, indicating a gradual shift in momentum from bearish to neutral. These signals suggest that a short-term bounce or pullback in price is possible, and the stock may move towards its 20-day moving average, which is currently around ₹3395.

#TechnicalViews#WatchOutFor#SectorBreakouts
Screenshot 2025-07-16 101854.png
631 likes·78 comments