‹ All Posts
RA Anupam Bajpai

18th May 2025 · SEBI-Registered Analyst

UBL
stock price analysis

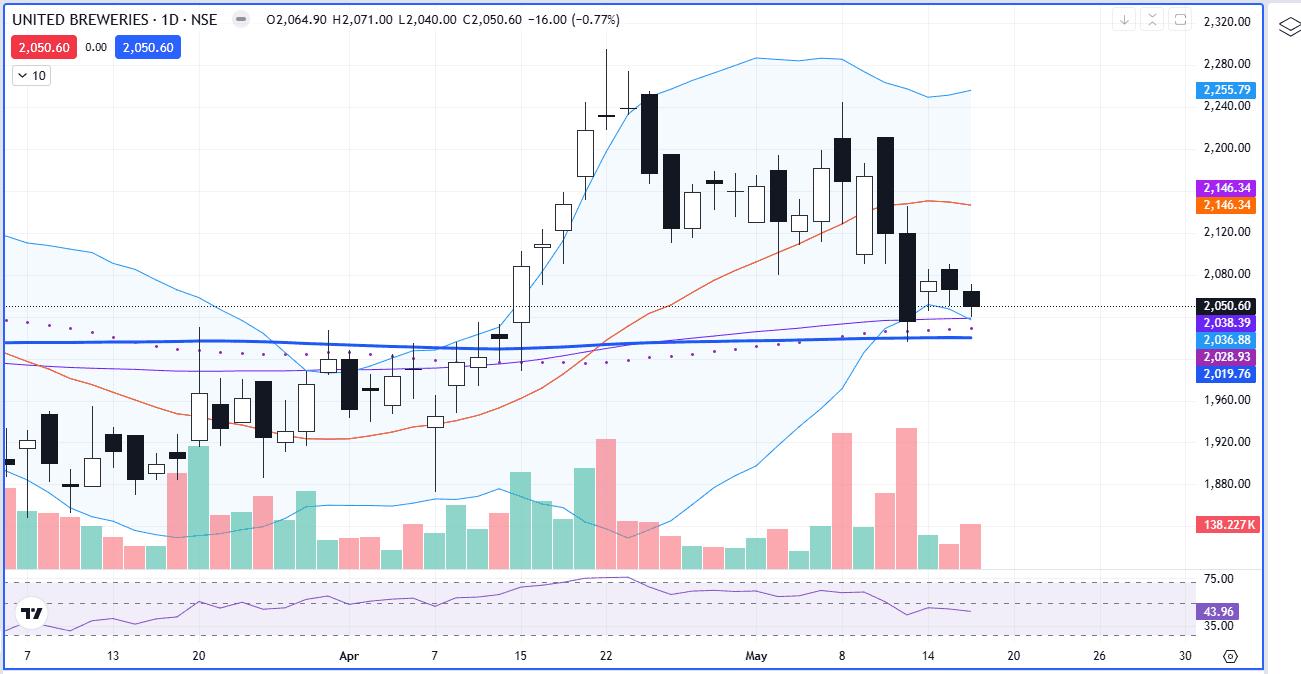
After giving its closing about 200 moving average, an uptrend has been seen on the chart of
UBL
, and on 22nd April and 23rd April 2025, a Doji Candlestick has been formed, and the candlestick was also outside the upper band of the Bollinger Band, RSI at that time was at 76 DOJI. It indicates that the bulls and bears are equally responsible for the formation of such a candlestick Also, this candlestick was formed outside the upper band of the Bollinger Band, which indicates a fall in price After that, continuous two days fall in the stock price was seen And from 28th April 2025 the stock price started consolidating between the range of 2090 and 2240 On 13th April,, it broke the support level but took support from the 200 moving average The 200 moving average will act as an important support level now, which is currently at 2020 The investor should wait till the stock price closes above the resistance level of 2090 or closes below the support level of 2020 If the stock price breaks resistance, we will be bullish, and if the stock price breaks the support level, we will be bearish

#WatchOutFor#TechnicalViews#EquityResearch
Screenshot 2025-05-18 094057.png
295 likes·46 comments